Spectral gamma-ray line features are expected as key signatures from dark matter (DM) annihilations of TeV-scale particle DM. Observations of the Galactic Center with atmospheric Cherenkov telescopes are unique to probe thermal-relic TeV particle DM, well beyond the reach of direct detection and collider searches. We report here on the search for line signals in very-high-energy gamma rays using data from the Inner Galaxy Survey, consisting of 546 hours of H.E.S.S. observations of the inner few degrees of the Galactic Center. No significant signal is detected. We then compute the exclusion limits on the annihilation line cross section ⟨𝜎𝑣⟩line, with two-dimensional log-likelihood ratio test statistics, exploiting spectral and spatial features of the DM signal. Assuming an Einasto DM density profile for the Milky Way, our results provide the most constraining limits so far, reaching ⟨𝜎𝑣⟩line = 2.3 × 10⁻²⁸ and 2.4 × 10⁻²⁷ cm3 s−1 for DM masses of 1 and 10 TeV, respectively. The present limits are used to constrain the widely searched Wino, Higgsino, and Quintuplet models. For the first time, thermal Higgsino DM is probed for DM Milky Way models.

Main Figures
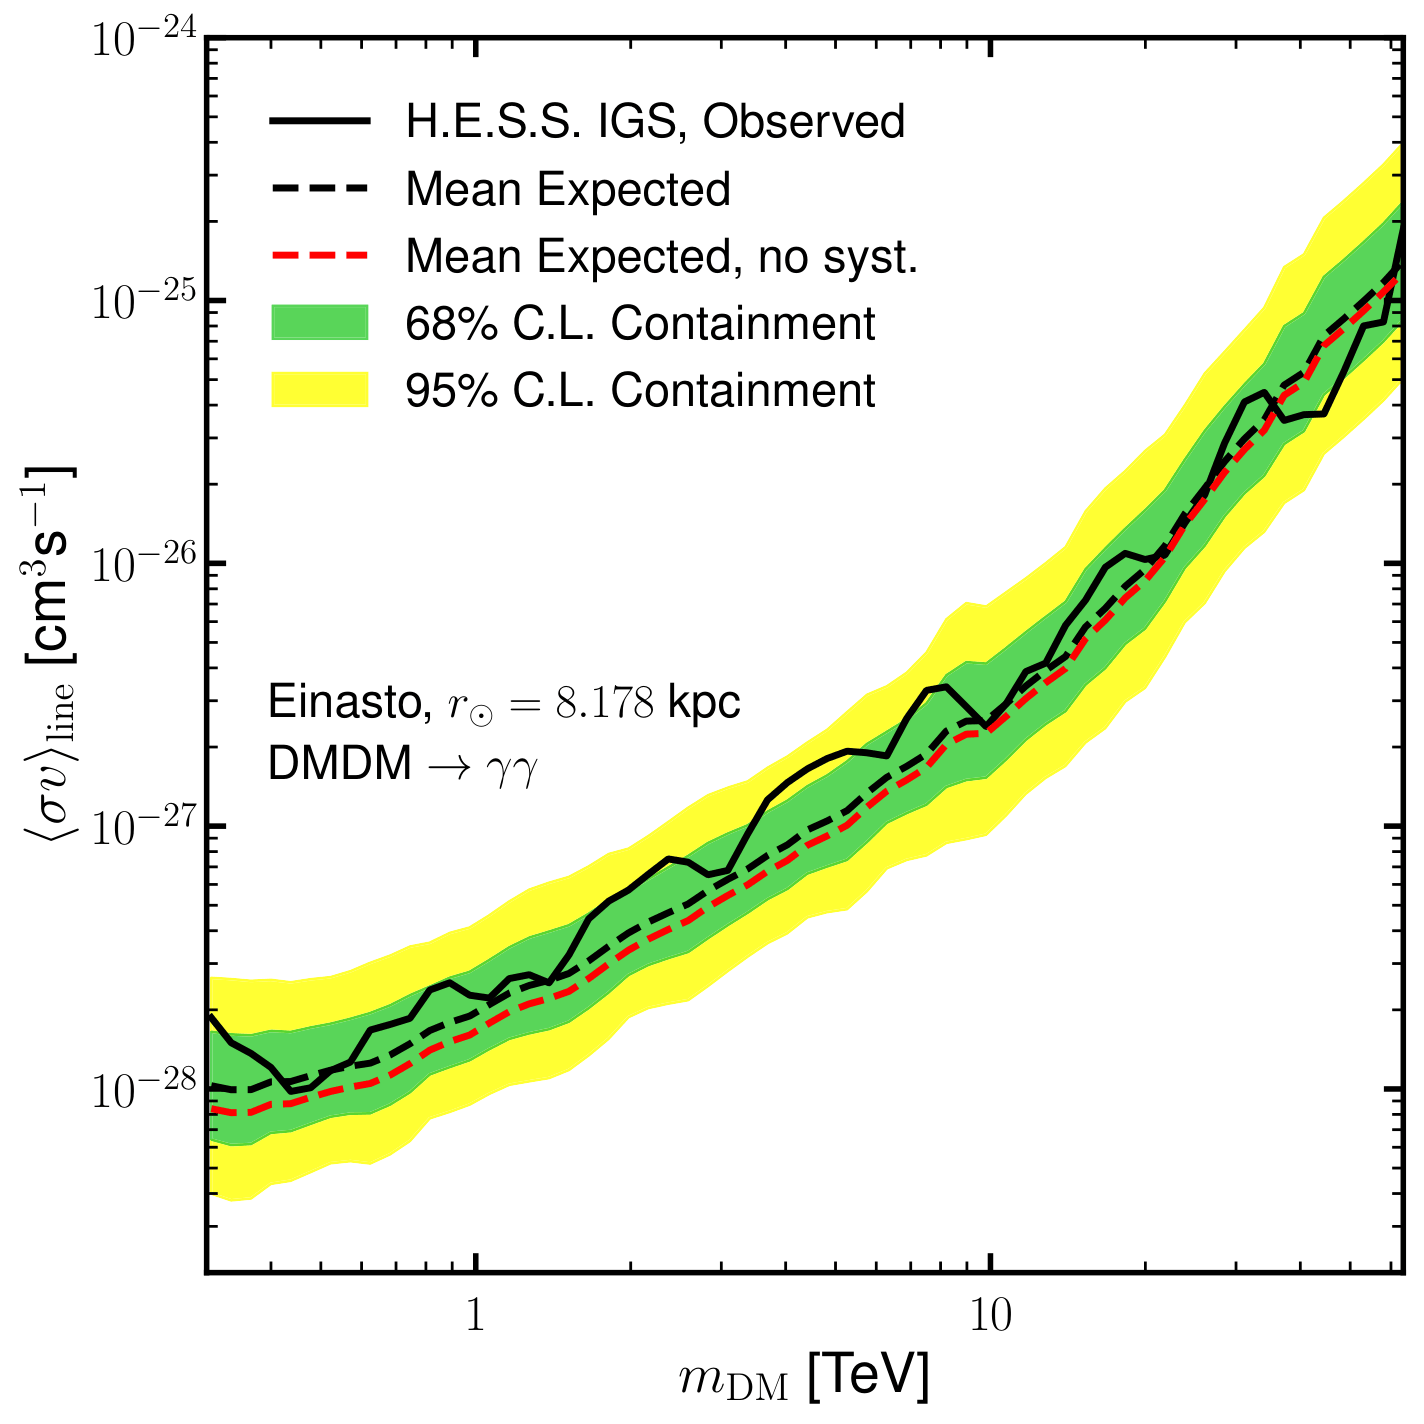
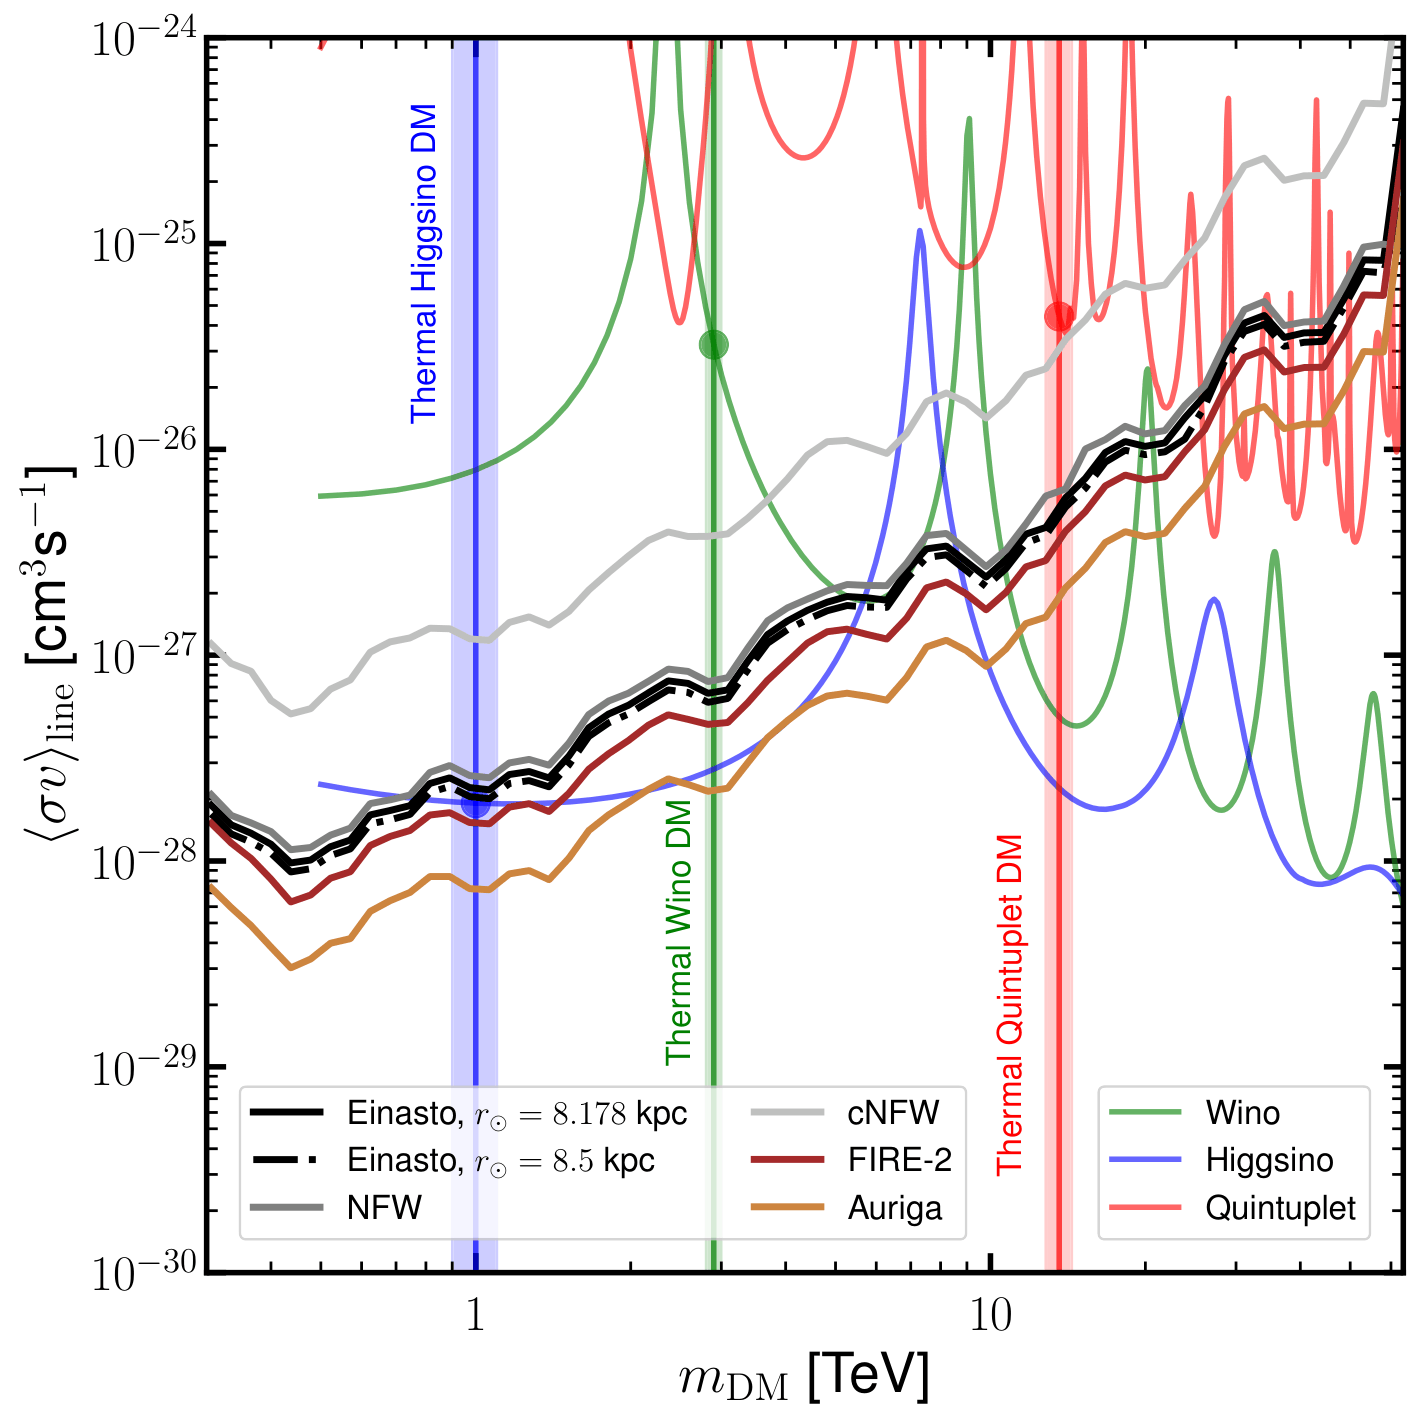
Figure 1 – Observed and expected upper limits on the annihilation cross section, comparison with canonical TeV dark matter models
 |
 |
| PDF, ECSV | PDF, ECSV |
| Caption: Left panel: 95% C.L. observed upper limits (solid black line) on the line cross section ⟨σv⟩line versus the DM mass mDM assuming the baseline Einasto profile for the DM distribution. 95% C.L. mean expected upper limits (black dashed line) together with the 1σ (green shaded area) and 2σ (yellow shaded area) containment bands, respectively, are also plotted. All these upper limits include systematic uncertainty. The mean expected upper limit without systematic uncertainty is drawn as the red dashed line. Right panel: 95% C.L. observed upper limits on the line cross section ⟨σv⟩line, where ⟨σv⟩line=⟨σv⟩γγ+1/2⟨σv⟩γZ, versus the DM mass compared to the theoretical line cross section computed at NLO for three canonical DM SU(2) models: the Wino (light green), the Higgsino (light blue), and Quintuplet (light red). For each model, the mass for which the correct relic abundance is obtained from a thermal cosmology is shown as the vertical band. The corresponding thermal cross sections are highlighted for the Wino, Higgsino, and Quintuplet as green, blue and red dots, respectively. The observed upper limits are shown for all the Milky Way DM density models adopted in this work. | |
Figure 2 – Observed upper limits on the annihilation cross section, comparison with results from other instruments
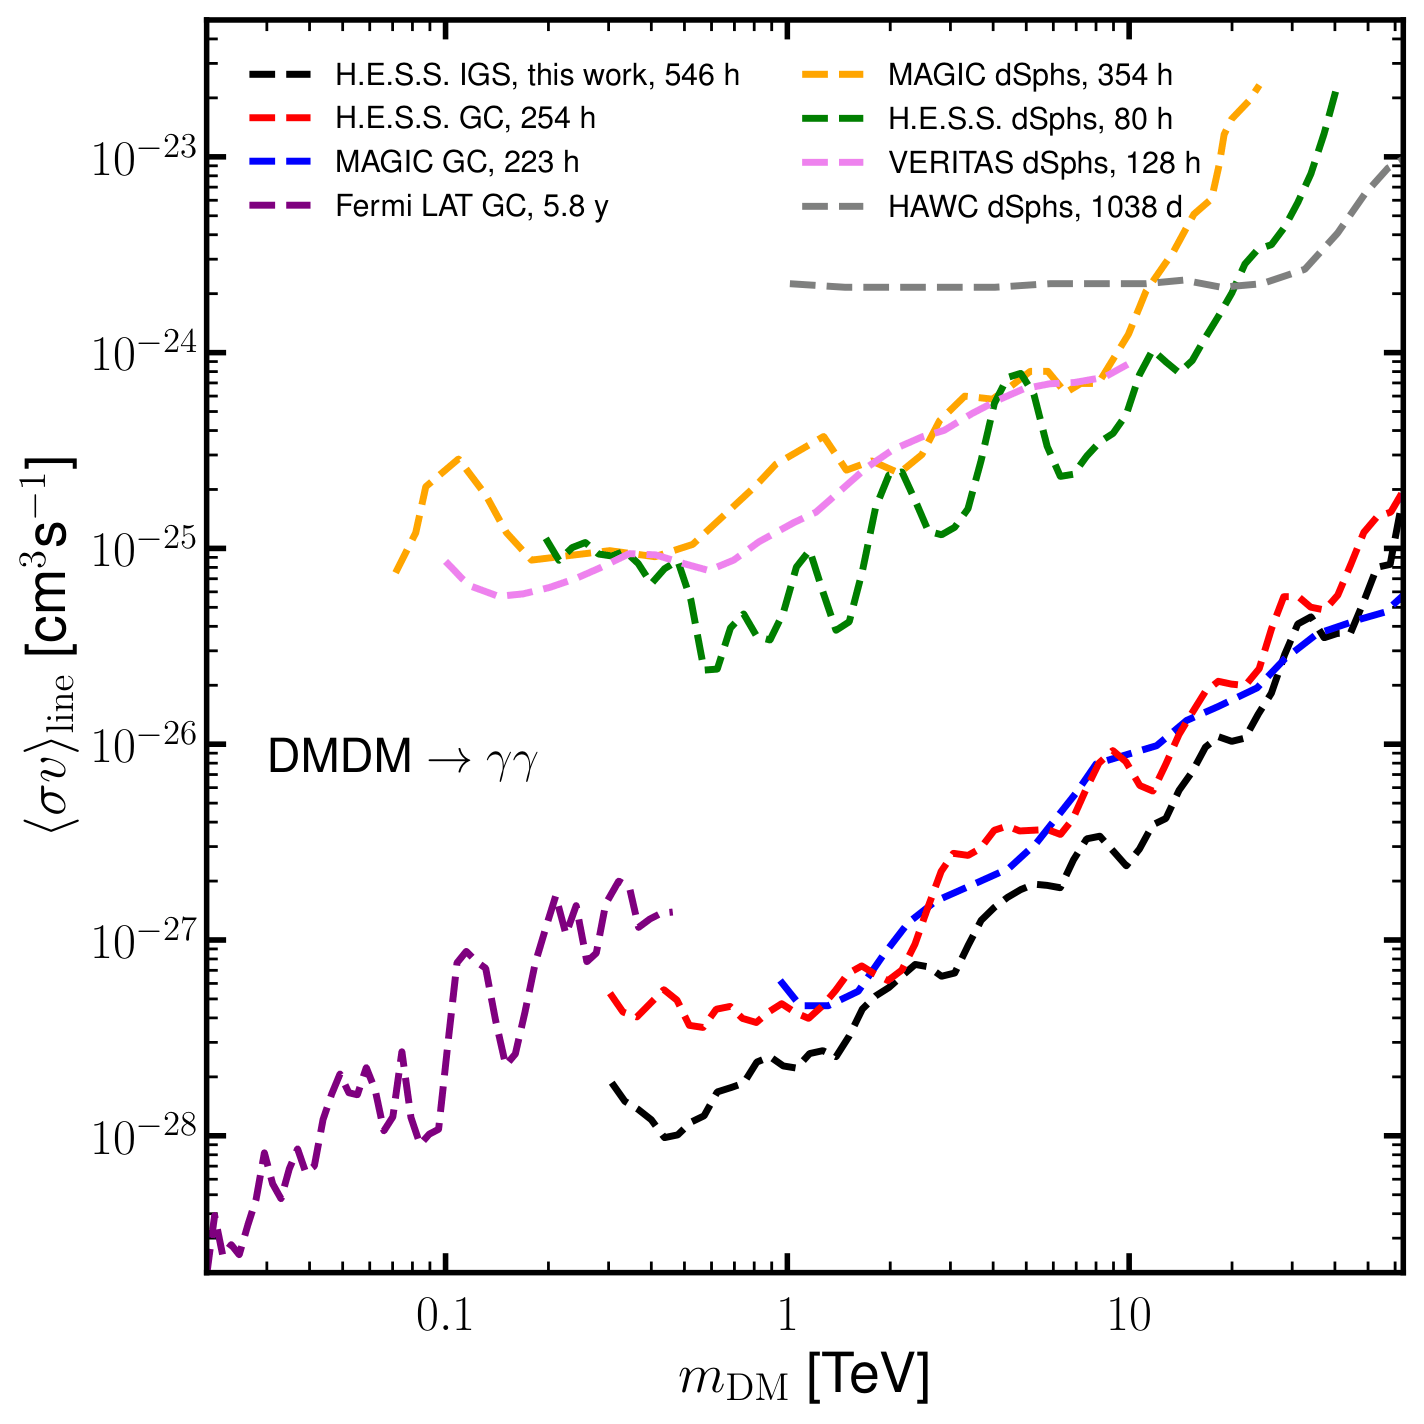
Caption: Current constraints on the line cross section ⟨σv⟩line versus the DM mass mDM including previous H.E.S.S. limits from 254 h of observations of the GC (red line), the limits from 223 h of GC observations with MAGIC (blue line), and the limits from 5.8 y of observations of the GC with the Fermi satellite (purple line). The limits from dwarf spheroidal galaxy observations with HAWC (grey line), H.E.S.S. (green line), MAGIC (yellow line) and VERITAS (pink line) are also plotted.
Supplemental Material Figures
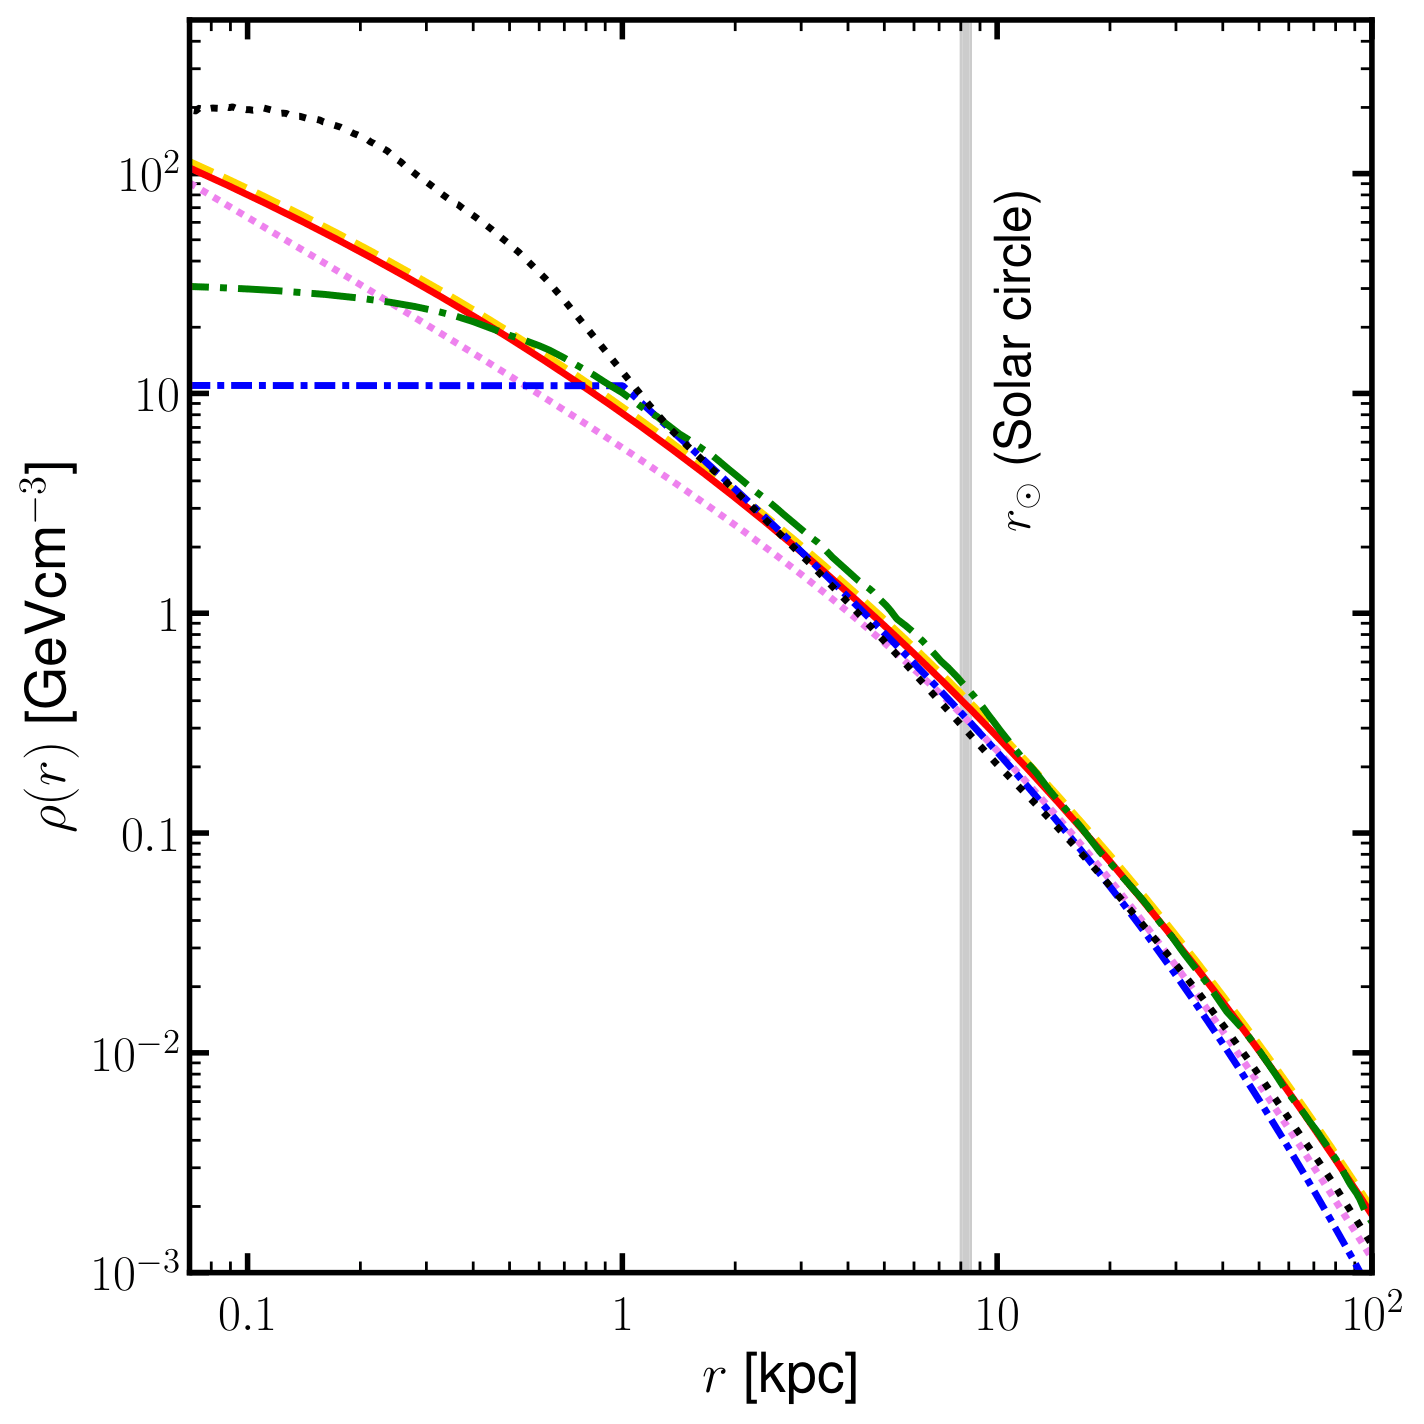
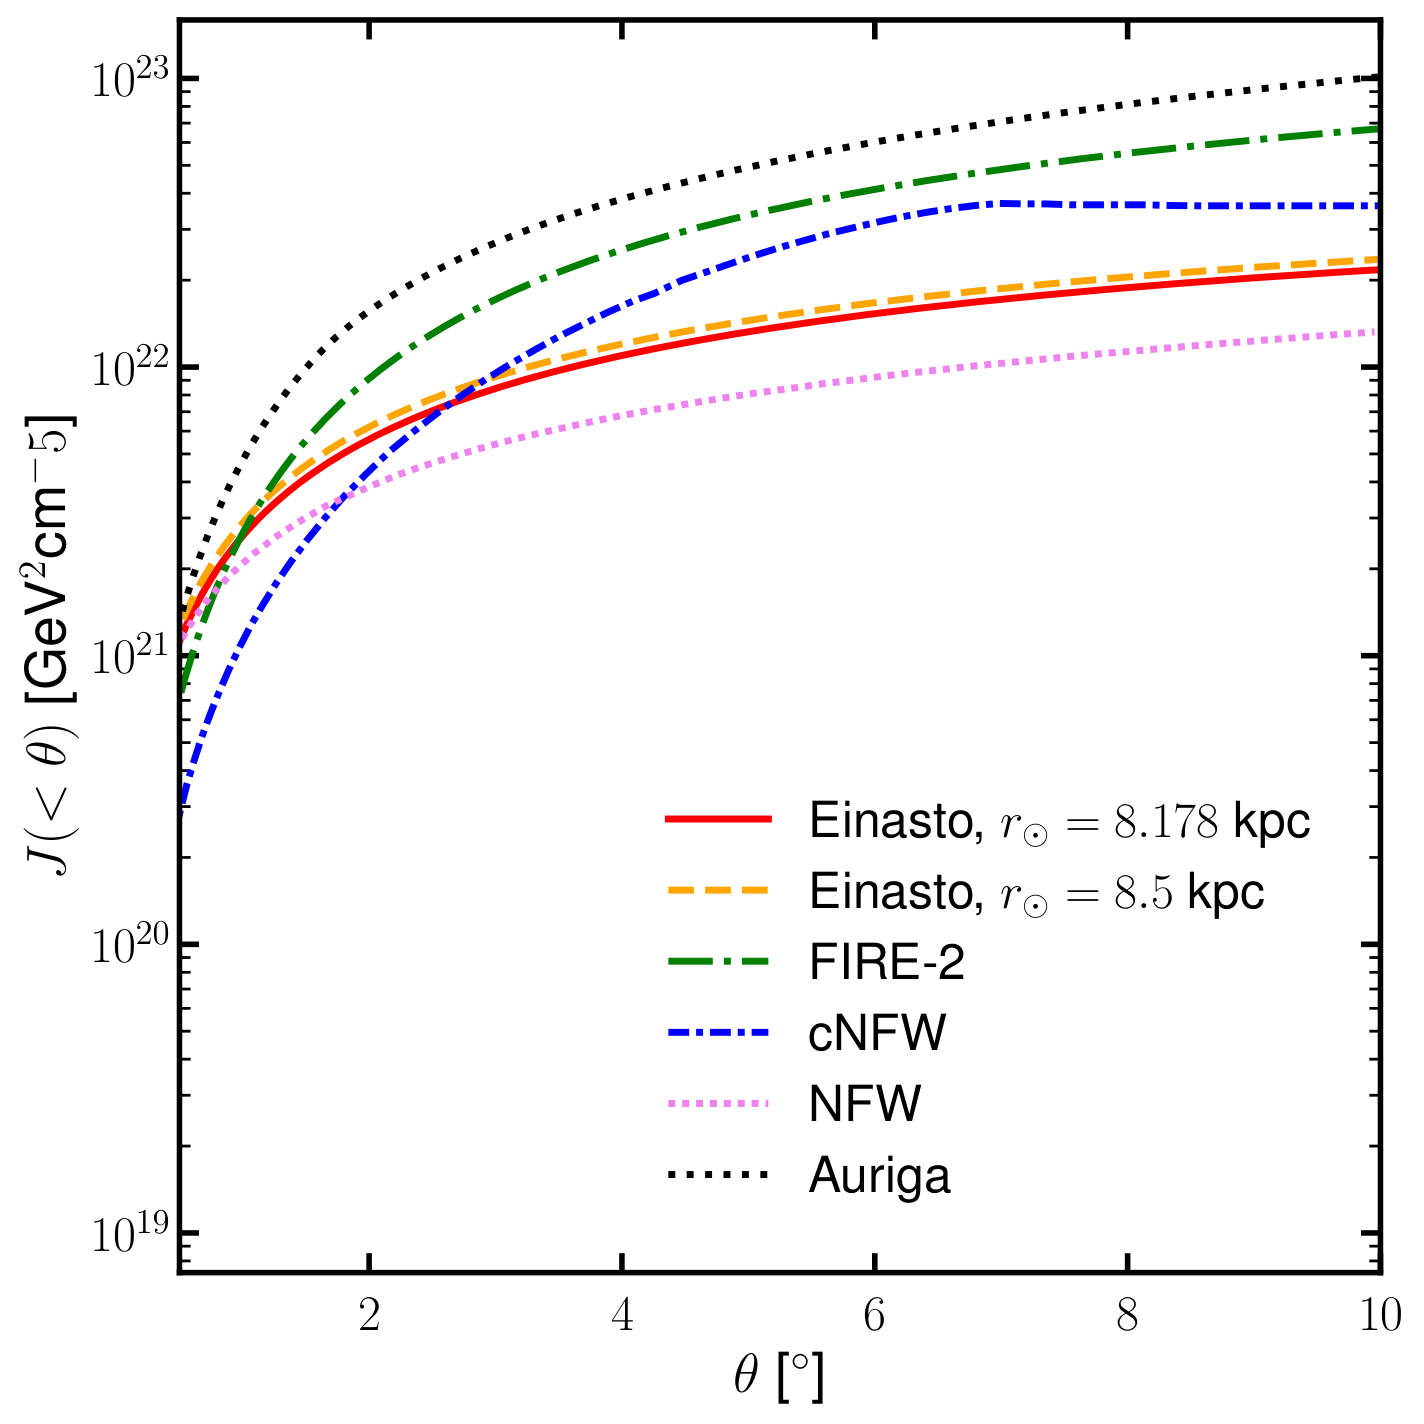
Figure S1 – Dark Matter density profiles and J-factors adopted in the paper
 |
 |
| PDF, ECSV | PDF, ECSV |
| Caption: Left panel: DM mass density profile ρ (GeV cm−3) as a function of the distance r (kpc) from the Galactic Centre for the DM halo models of the Milk Way discussed here. The Einasto profile is plotted assuming r⊙ = 8.5 kpc (orange dashed line), and r⊙ = 8.178 kpc (red solid line). The NFW and cNFW profiles (purple densely dotted and blue dash-dotted lines) are shown too. The non-parametric geometric mean profiles extracted from the hydrodynamical simulations FIRE-2 and Auriga (green long-dash-dotted and black dotted lines), respectively, are also displayed. The profiles are normalized according to ρ(r⊙) displayed in Tab. 1. The vertical grey band encompasses the values used for the solar distance r⊙ adopted for the computation of the different J-factor profiles used in this work. Right panel: Integrated J-factors (GeV2 cm−5) as a function of the angular distance (deg.) from the Galactic Centre for the DM mass density profiles on the left panel. Since exclusion regions mask a part of the solid angle in our analysis, the effective J-factors are reduced compared to the ones displayed here. | |
