The colliding-wind binary system η Carinae has been identified as a source of high-energy (HE, below ∼100 GeV) and very high-energy (VHE, above ∼100 GeV) gamma rays in the last decade, making it unique among these systems. With its eccentric 5.5-year-long orbit, the periastron passage, during which the stars are separated by only 1–2 au, is an intriguing time interval to probe particle acceleration processes within the system. In this work, we report on an extensive VHE observation campaign that for the first time covers the full periastron passage carried out with the High Energy Stereoscopic System (H.E.S.S.) in its 5-telescope configuration with upgraded cameras. The VHE gamma-ray emission from η Carinae was detected during the periastron passage with a steep spectrum with the spectral index Γ = 3.3 ± 0.2stat ± 0.1syst. Together with previous and follow-up observations, we derive a long-term light curve sampling one full orbit, showing hints of an increase in the VHE flux towards periastron, but no hint of variability during the passage itself. An analysis of contemporaneous Fermi-LAT data shows that the VHE spectrum represents a smooth continuation of the HE spectrum. From modelling the combined spectrum, we conclude that the gamma-ray emission region is located at distances of ∼10–20 au from the centre of mass of the system and that protons are accelerated up to energies of at least several tera-electronvolts inside the system in this phase.

Intro
Below the auxiliary information for all figures in the publication Detection of very high-energy gamma-ray emission from Eta Carinae during its 2020 periastron passage (A&A, 2025) is provided. This includes the pdf versions of all Figures and fits files for maps and fits or txt files for any flux or light curve points.
Main Figures
Figure 1 – NSB map
Caption: Average NSB photon rate for the η Car field using CT5. The map has been derived by averaging the NSB maps from all observations of the 2020 dataset (DS-C). The position of η Car is shown with a white triangle. Contour levels for better visualisation have been added at 0.6, 1.2, and 1.8 GHz. The map is zoomed in from the full FoV for better visibility of the main features.
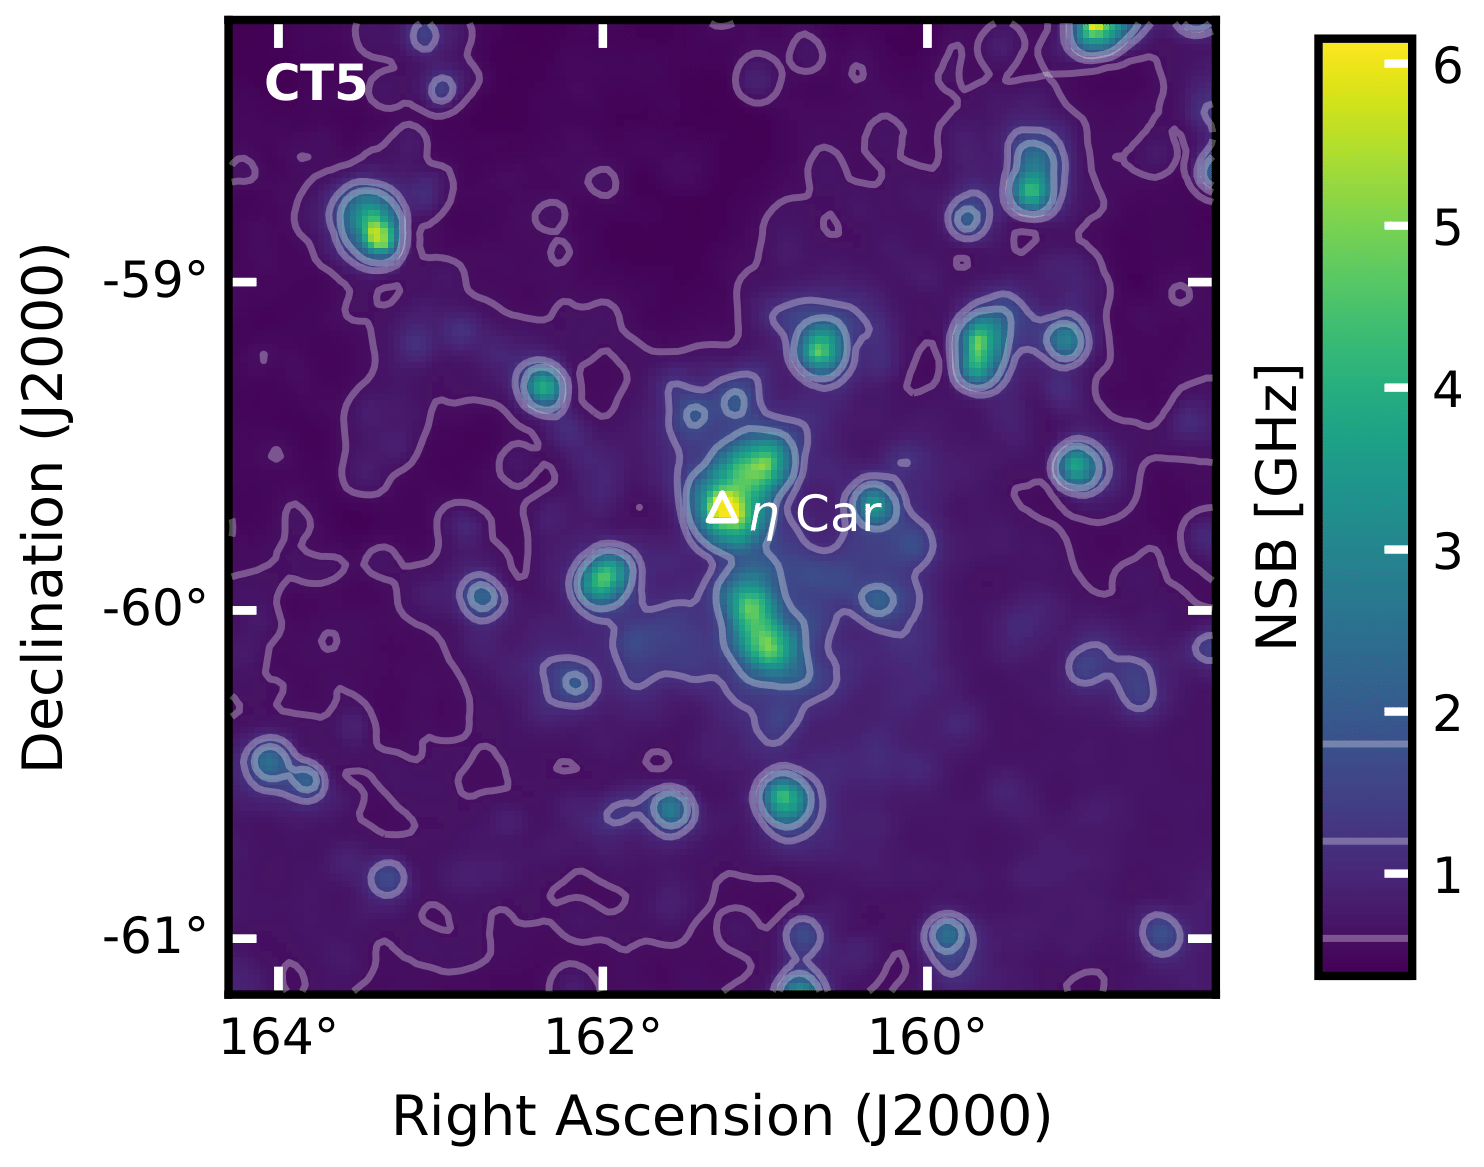
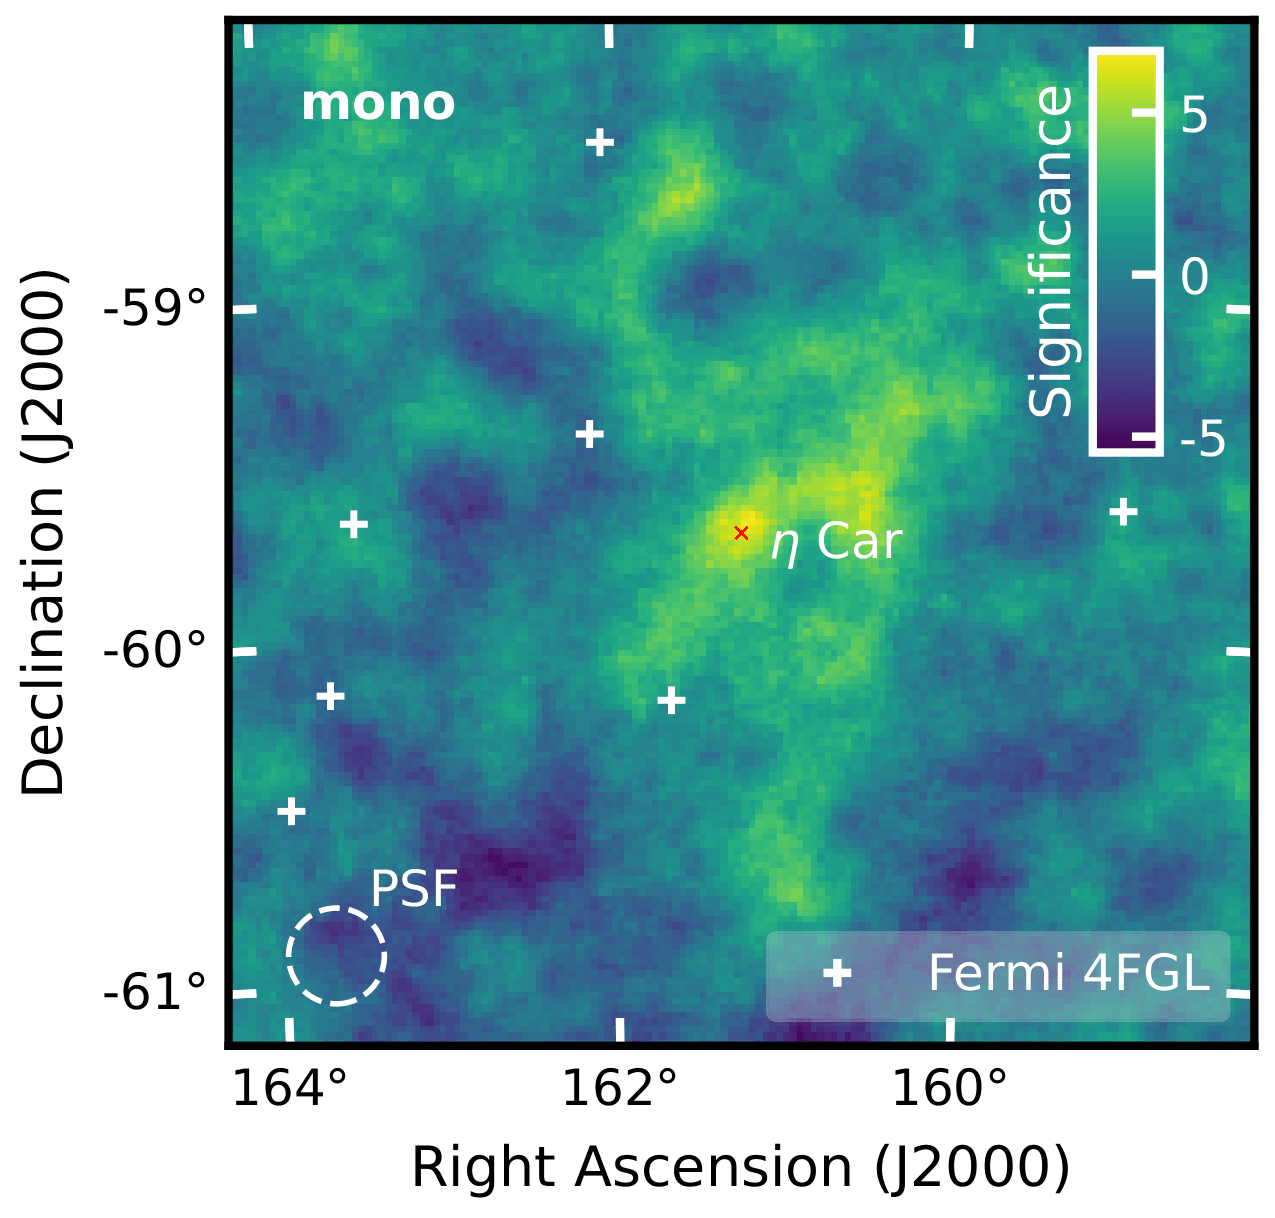
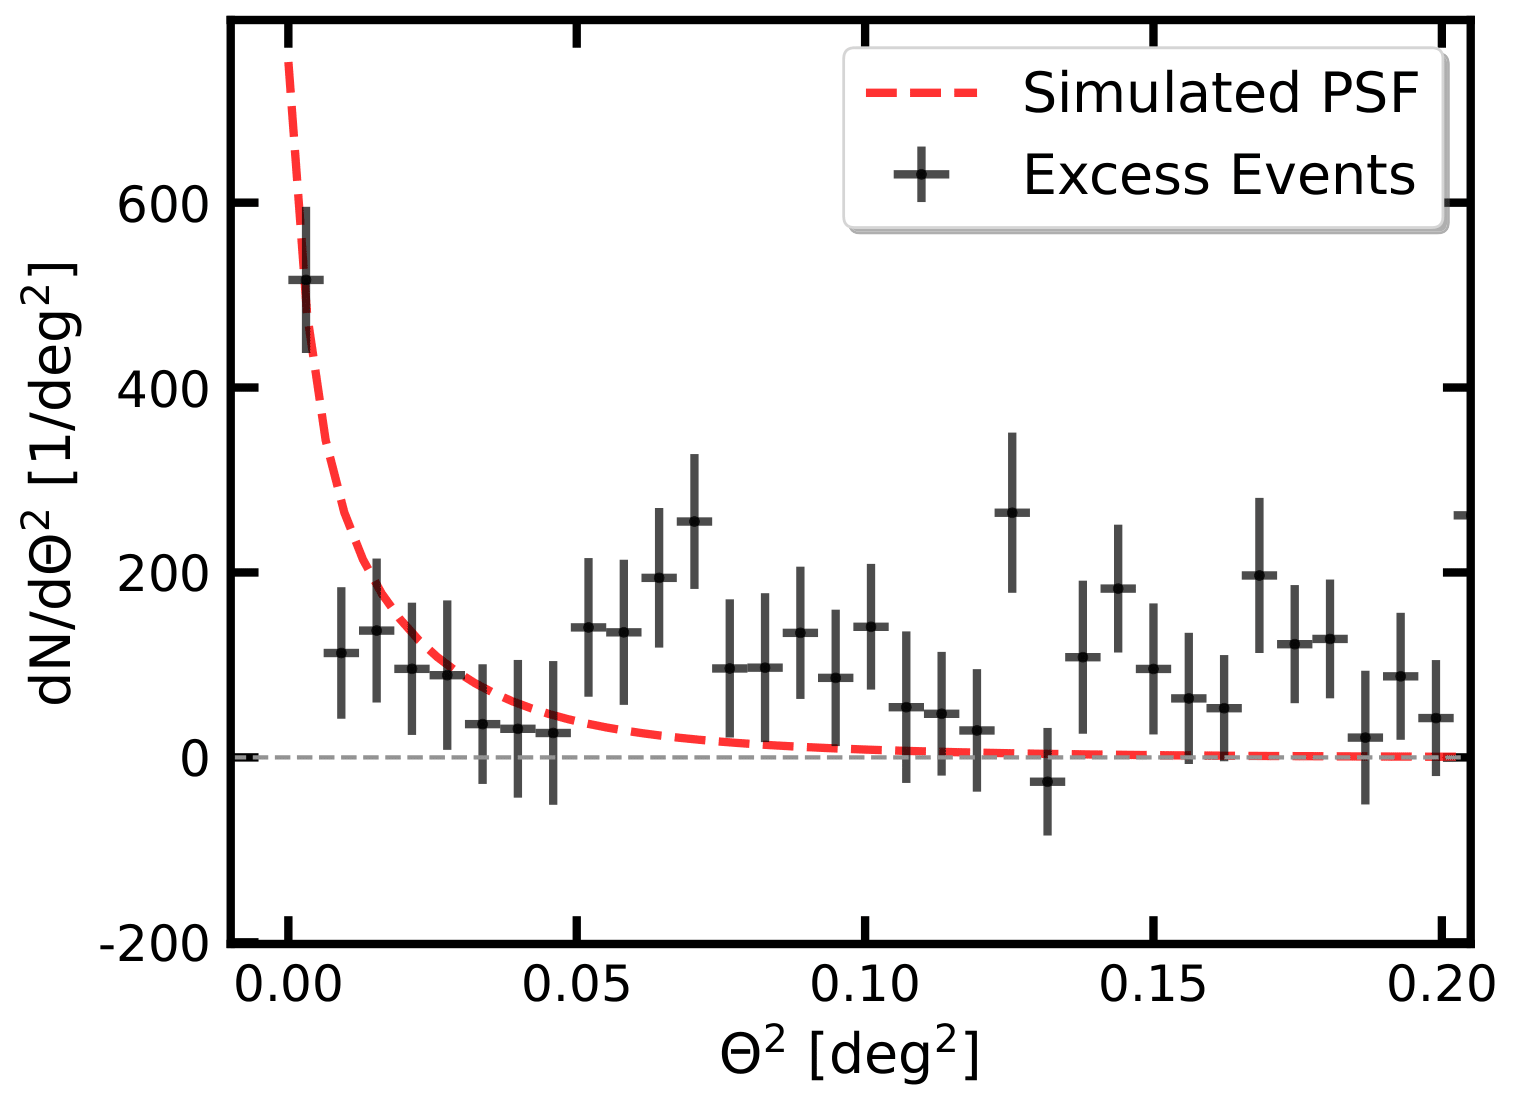
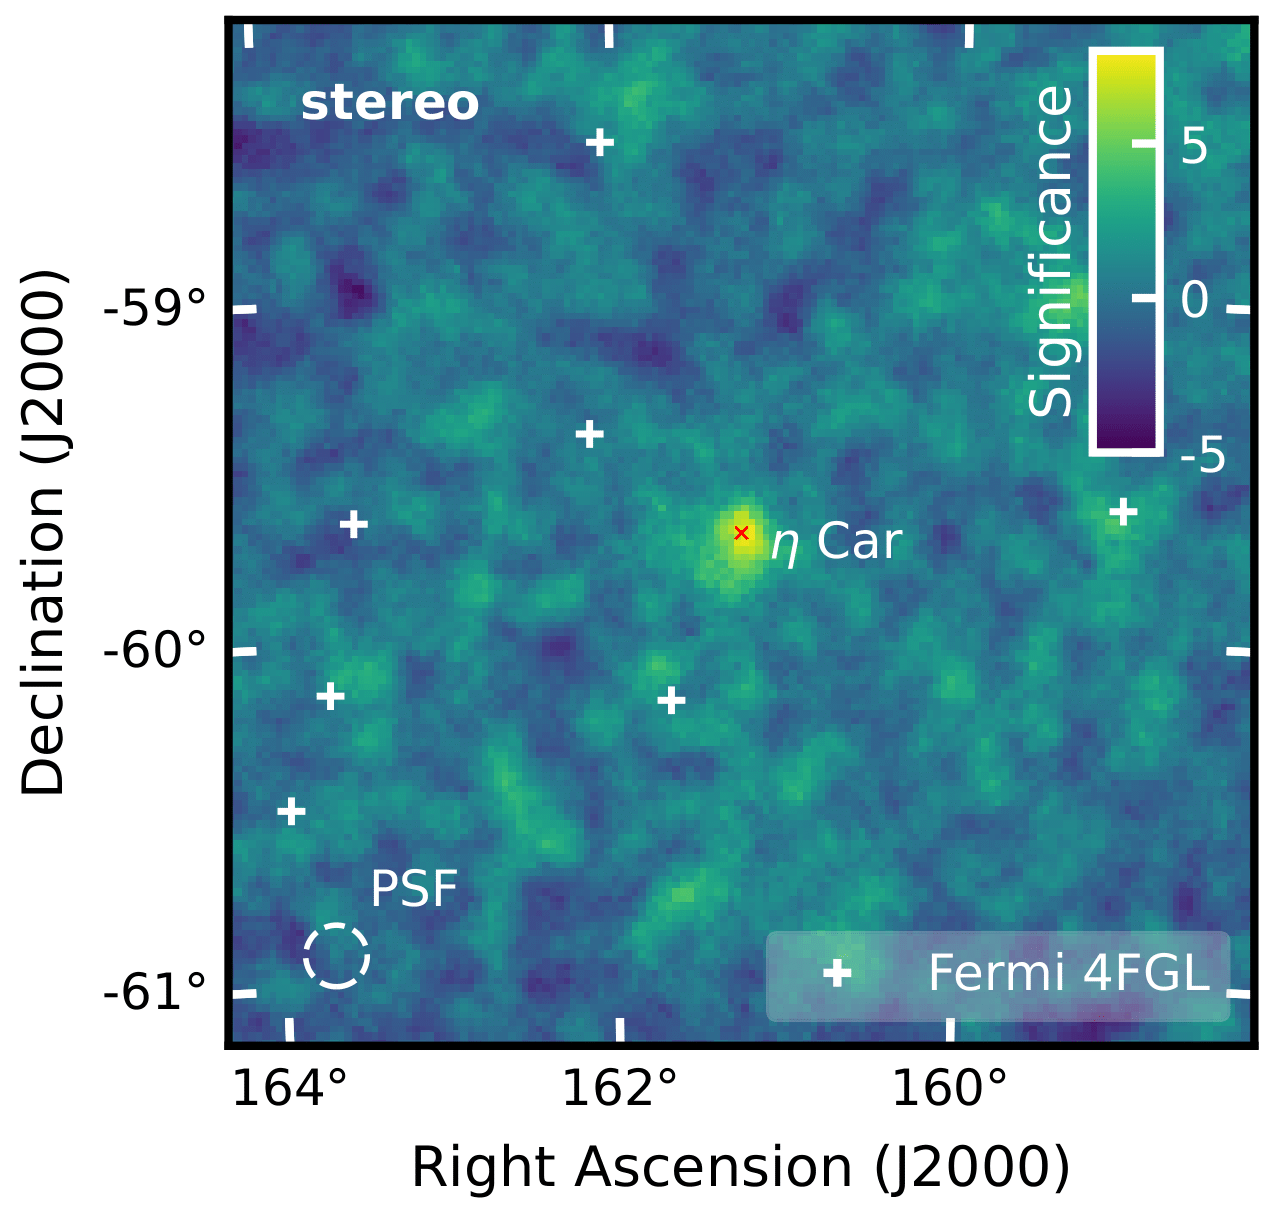
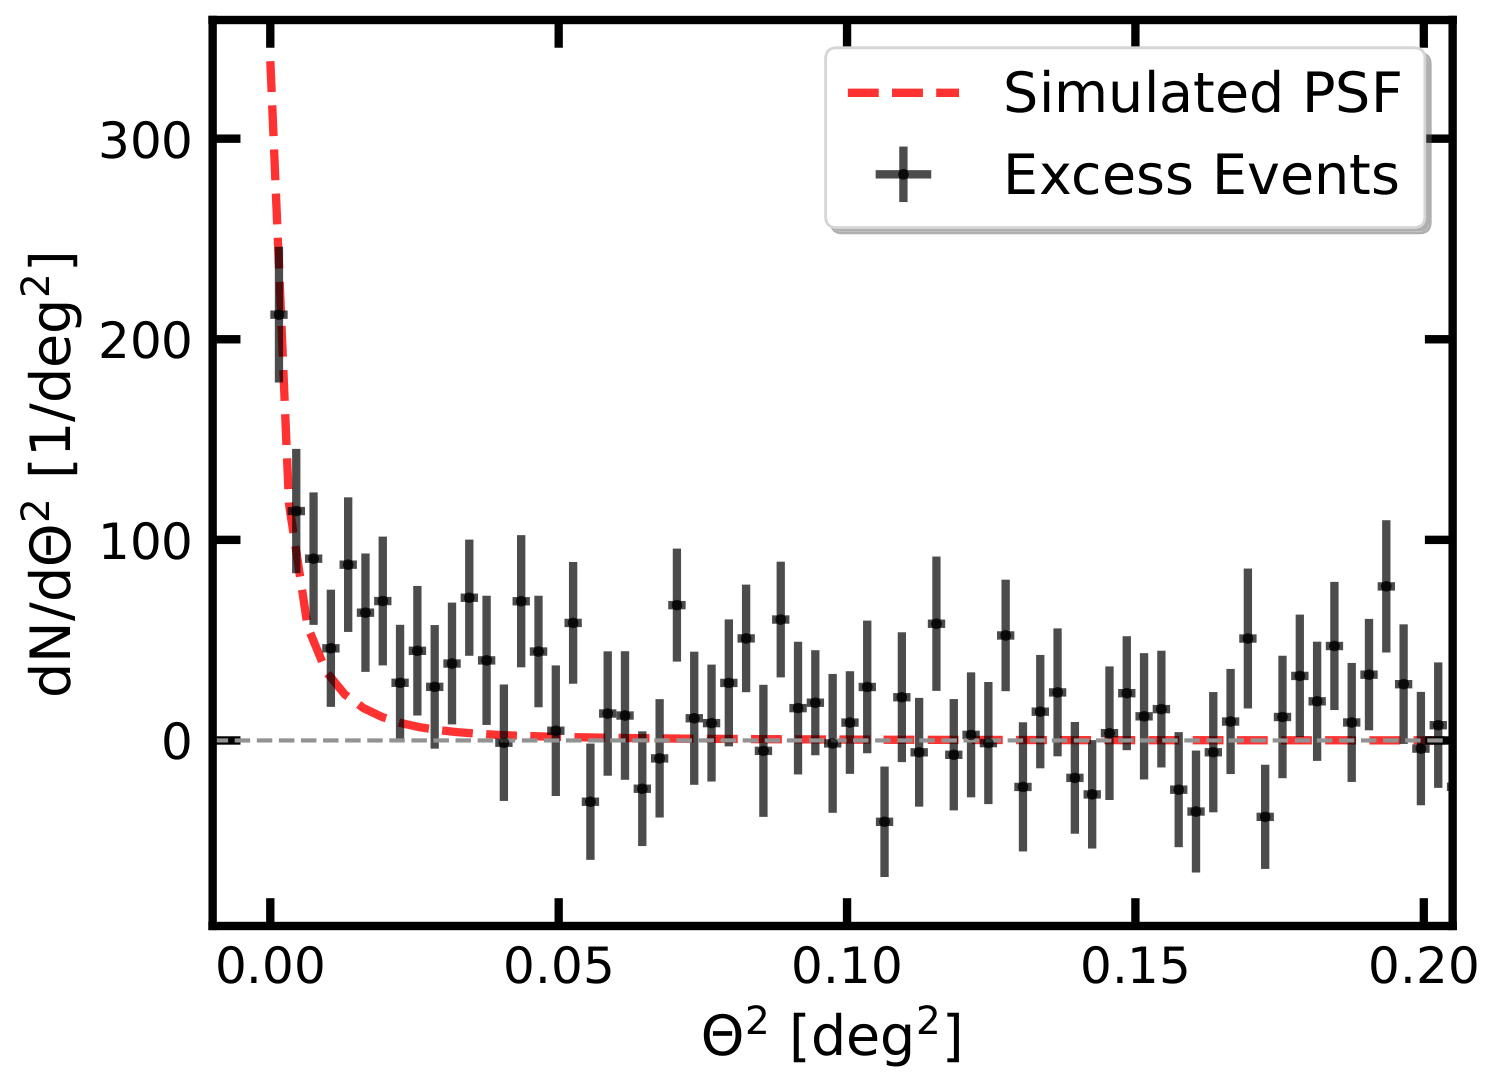
Figure 2 – Significance Maps
Caption: Significance maps and radial excess distributions of the η Car periastron dataset (DS-C). The resulting significance maps for CT5 mono and CT1-4 stereo are shown with correlation radii of 0.13° and 0.09°, respectively. The position of η Car is marked with a red cross. Additionally, all other Fermi-LAT 4FGL sources (Abdollahi et al. 2022b) in the FoV are marked. The radial excess distributions for mono and stereo analyses are centred on the η Car position. They are compared to the PSF derived from simulations with an assumed index of 3.3. The scale of the PSF was matched to the first bin.
Mono analysis
Stereo analysis
stereo map pdf
stereo map fits
stereo excess distribution pdf
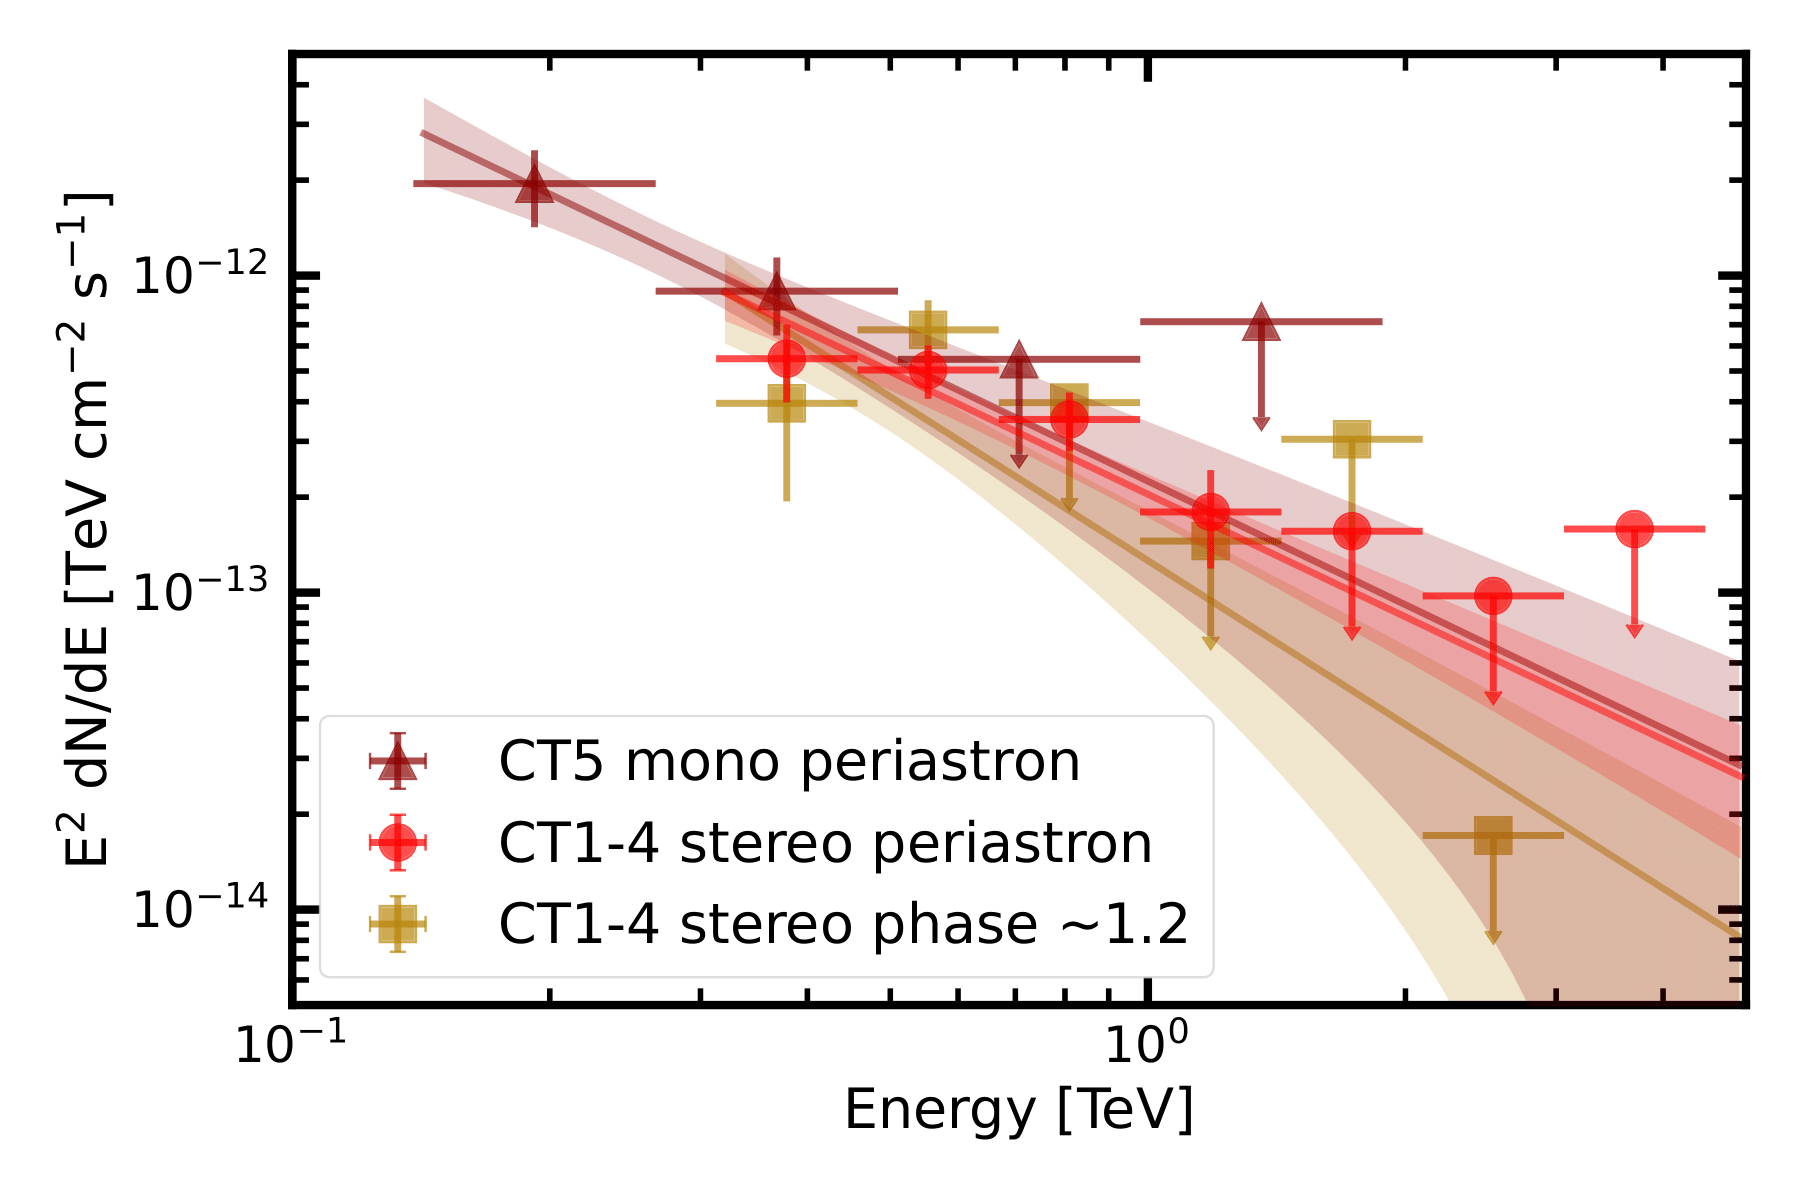
Figure 3 – H.E.S.S. spectral results
caption: Resulting spectral model from the stereo analysis of the periastron dataset (DS-C, red circles) compared to the spectral model derived in the mono analysis (dark red triangles) of the same dataset. Furthermore, the best-fit spectral model for the 2021 dataset (DS-D, yellow squares) at phase ∼1.2 is shown. Additionally, also the derived flux points are compared. The error estimates plotted are statistical uncertainties only.
Flux points (fits files)
mono
stereo
stereo – phase 1.2
Models (fits files)
mono
stereo
stereo – phase 1.2
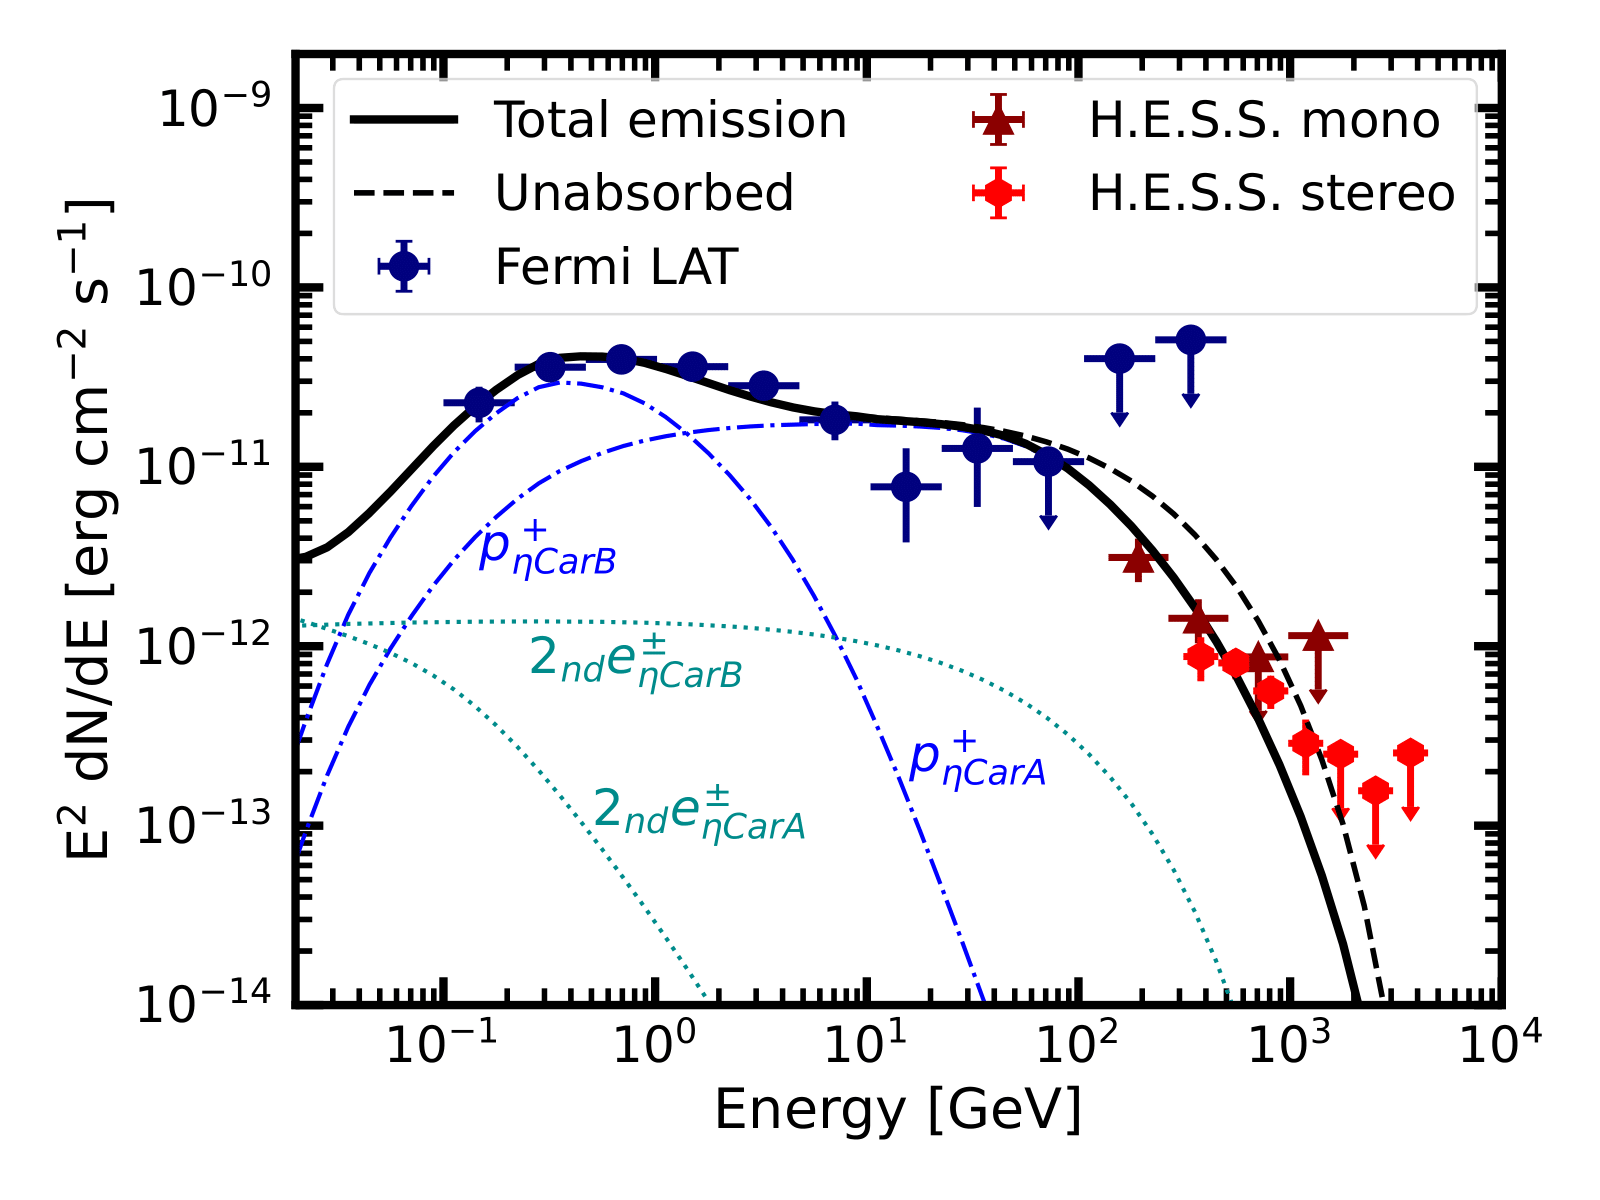
Figure 4 – H.E.S.S. and Fermi spectral results
caption: Fermi-LAT and H.E.S.S. flux points for the SED obtained around the 2020 periastron (orbital phase 0.97-1.05). The total periastron model as well as the individual components from White et al. (2020), assuming a radial distance of the gamma-ray emission of 20 au as is discussed in the text, is shown. The individual components denote the absorbed hadronic and secondary leptonic components from both winds. The dashed line denotes the unabsorbed model.
Flux points (fits files)
H.E.S.S. mono
H.E.S.S. stereo
Fermi-LAT
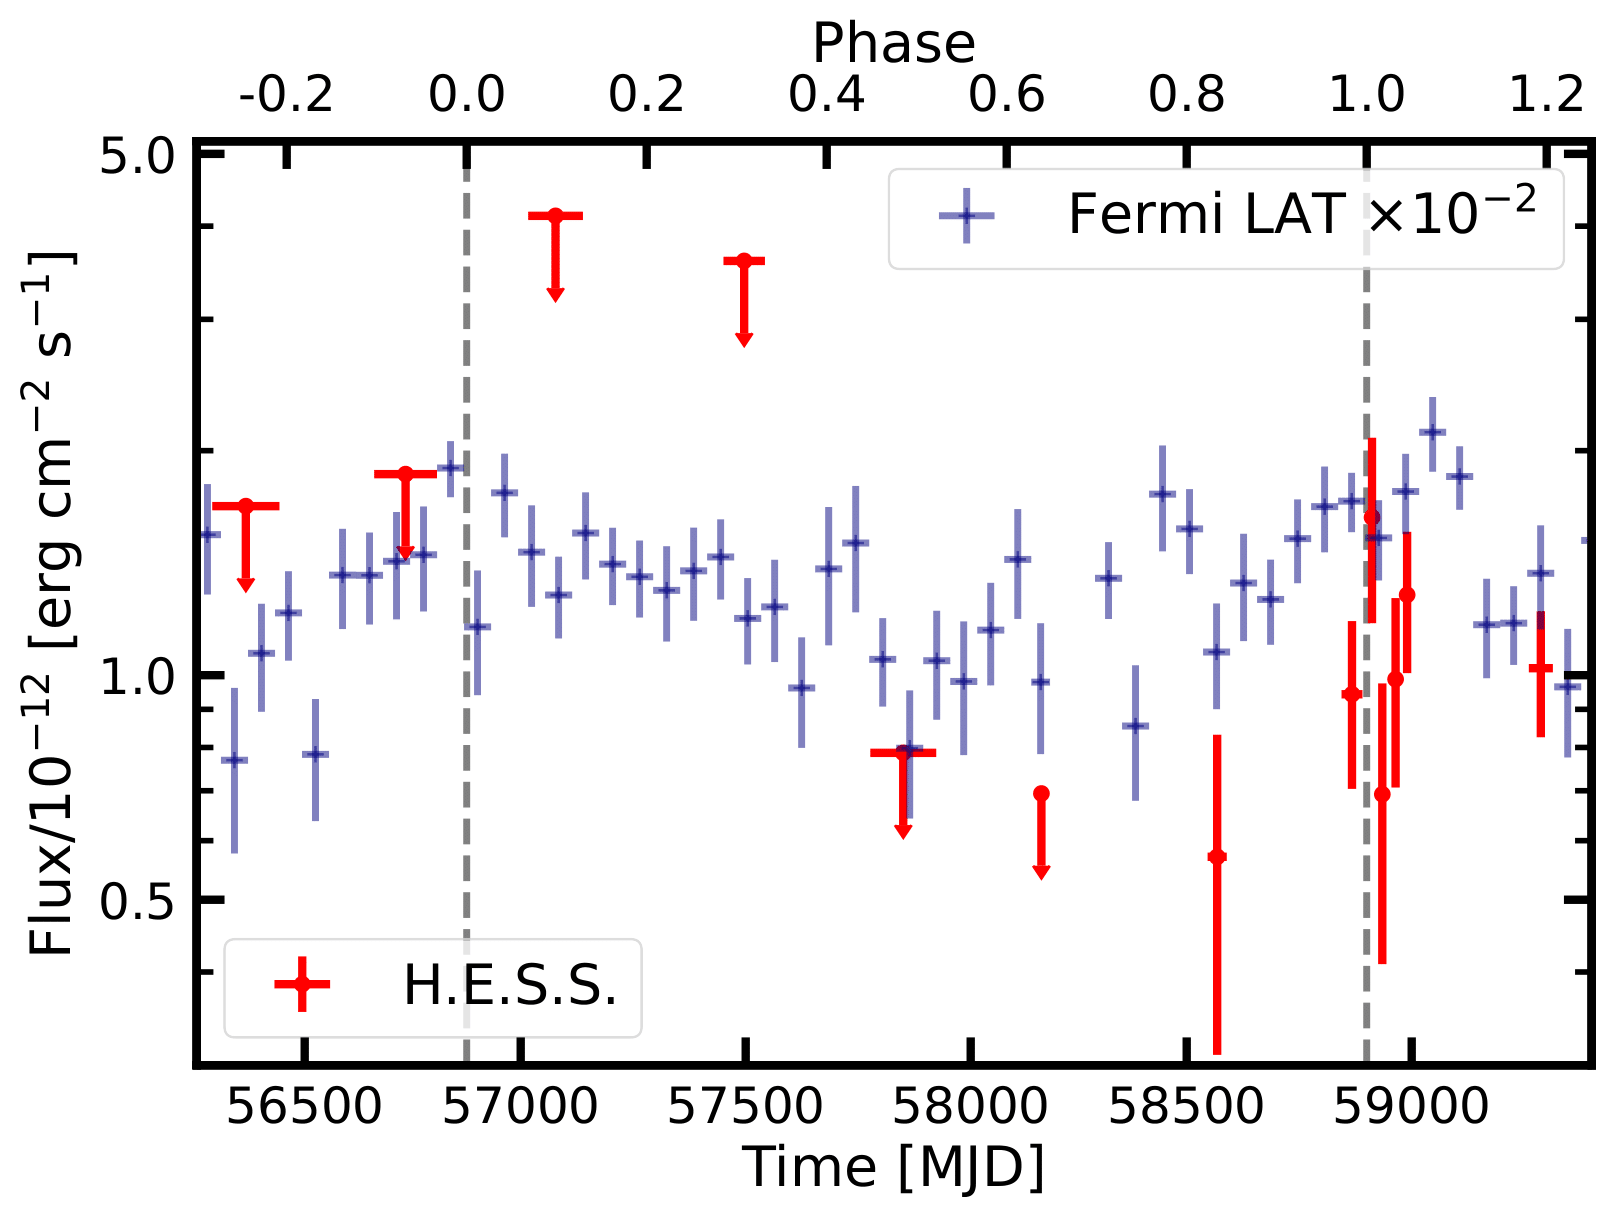
Figure 5 – H.E.S.S. and Fermi light curve
caption: H.E.S.S. light curve (red) above 310 GeV derived from the stereo data in this work compared to the Fermi-LAT light curve (blue) above 100 MeV (scaled down with 10−2 ) with a bin size of ∼ 60 days. The dashed lines represent the periastron passages of 2014 and 2020 at phases 0 and 1, respectively. The error bars correspond to the 68 % confidence interval and upper limits (at 95 % confidence) were calculated for phase bins with a less than 2 σ detection significance.
Light curve points (txt files)
H.E.S.S. stereo
Fermi-LAT
Appendix
Fig A.1
2025_EtaCar_FigA1_deltarecovsmc_before.pdf
2025_EtaCar_FigA1_deltarecovsmc_after.pdf
Fig B.1
2025_EtaCar_FigB1_eta_mono_sign_excl_comp.pdf
2025_EtaCar_FigB1_comp_etacar_thetasqr_col_nsb.pdf
Fig B.2
2025_EtaCar_FigB2_mono_comp_wflp_paper2020.pdf
Fig D.1
2025_EtaCar_FigD1_absorption_vs_radialdistance.pdf
2025_EtaCar_FigD1_emax_dependence.pdf
