HESS J1809–ˆ’193: a halo of escaped electrons around a pulsar wind nebula?

Abstract

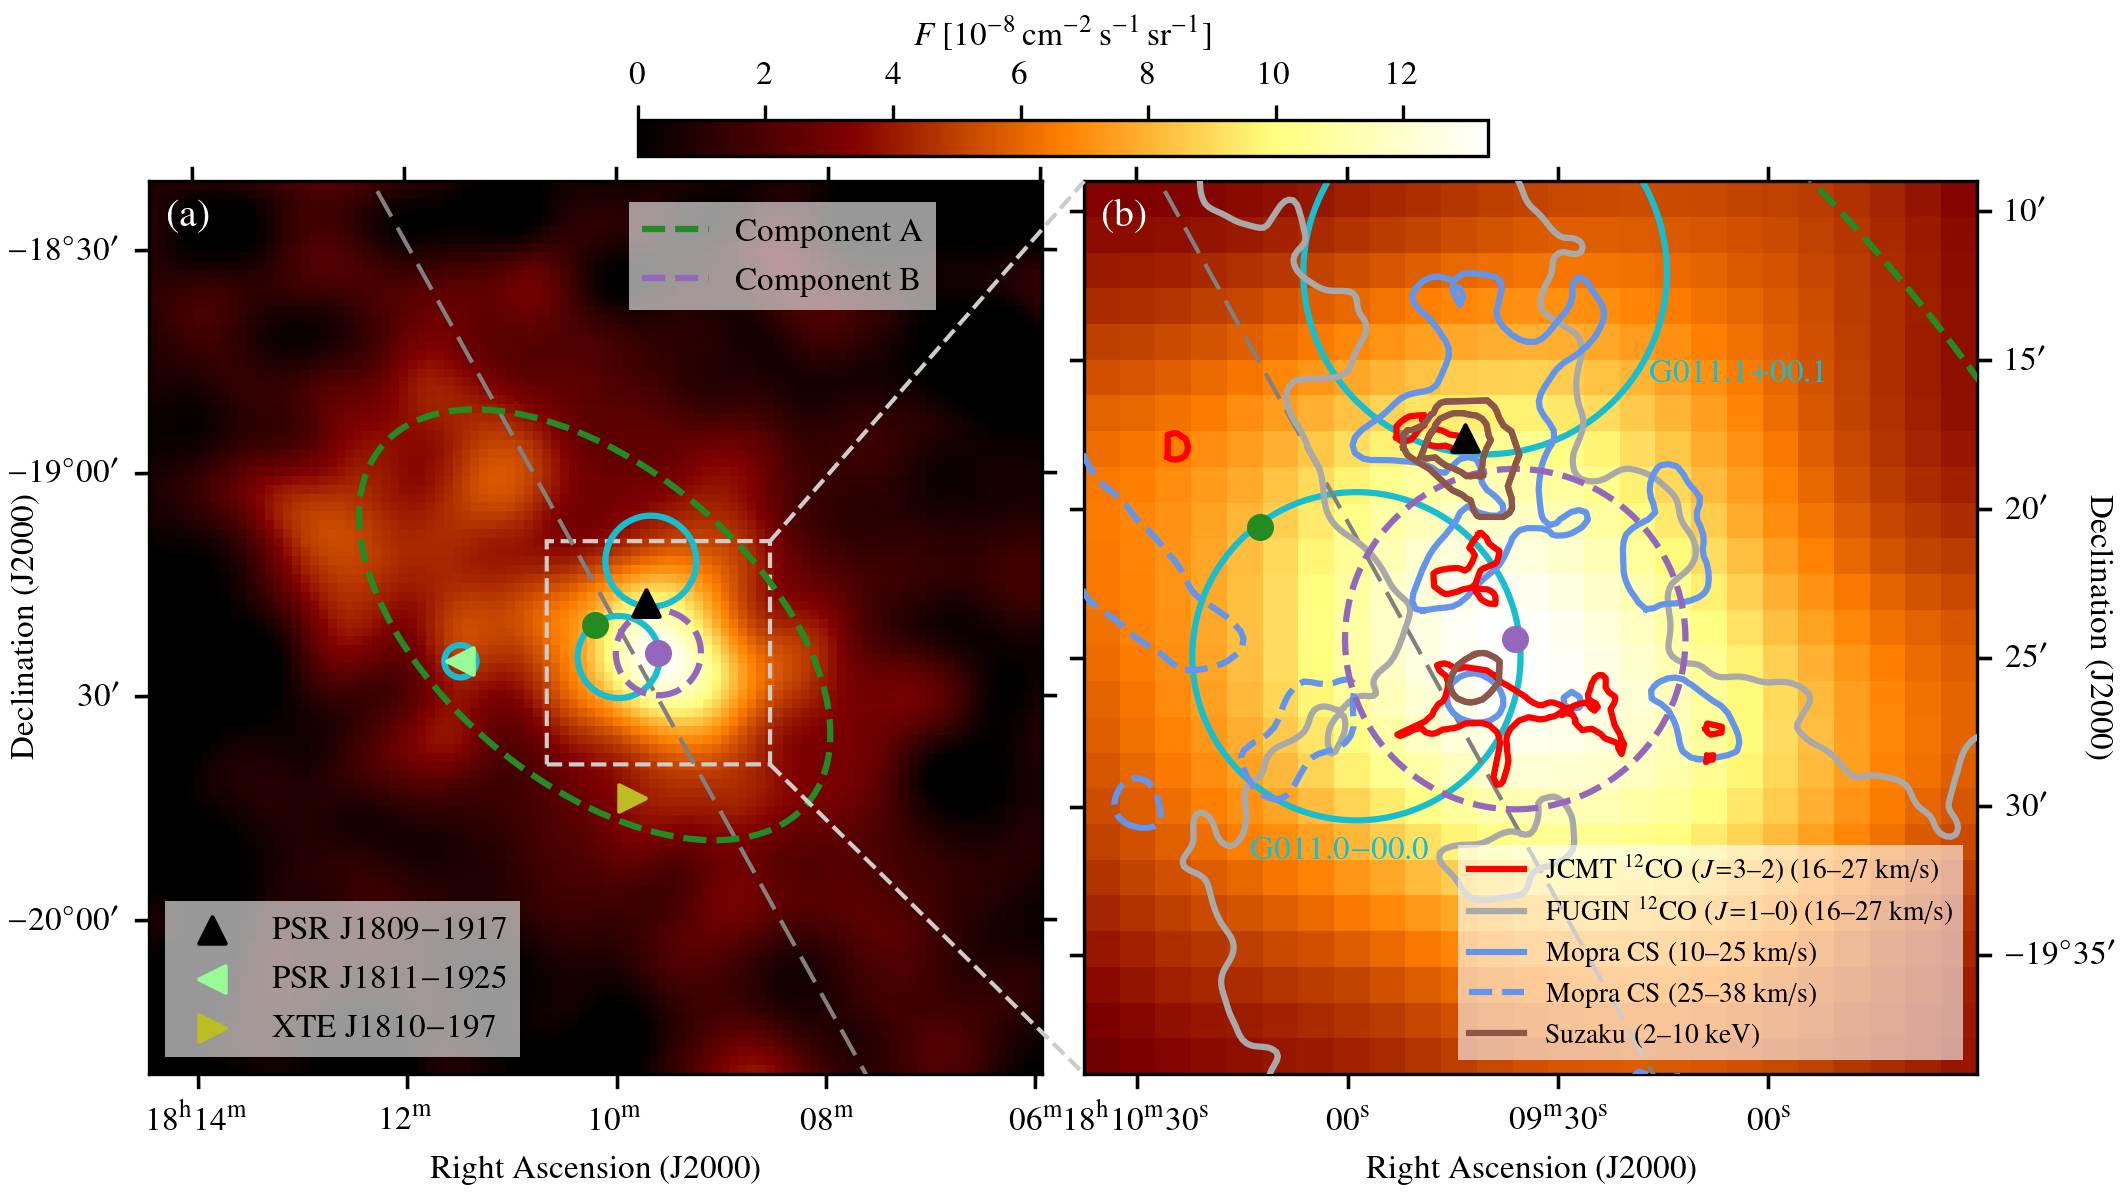
Context. HESS J1809−193 is an unassociated very-high-energy γ-ray source located on the Galactic plane. While it has been connected to the nebula of the energetic pulsar PSR J1809−1917, supernova remnants and molecular clouds present in the vicinity also constitute possible associations. Recently, the detection of γ-ray emission up to energies of ∼100 TeV with the HAWC observatory has led to renewed interest in HESS J1809−193.

Aims. We aim to understand the origin of the γ-ray emission of HESS J1809−193.

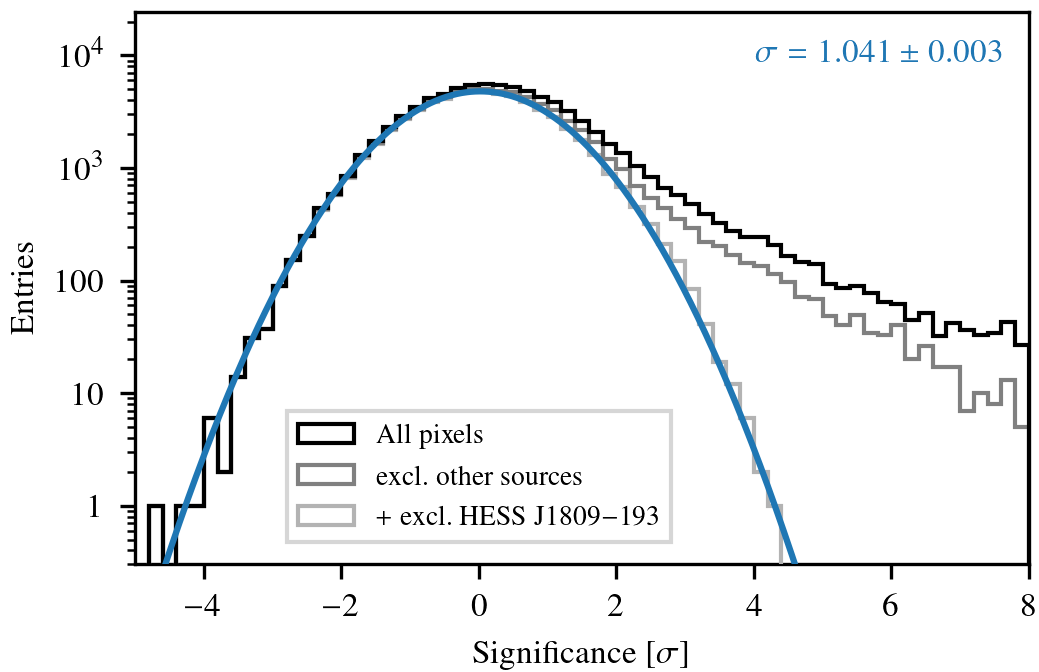
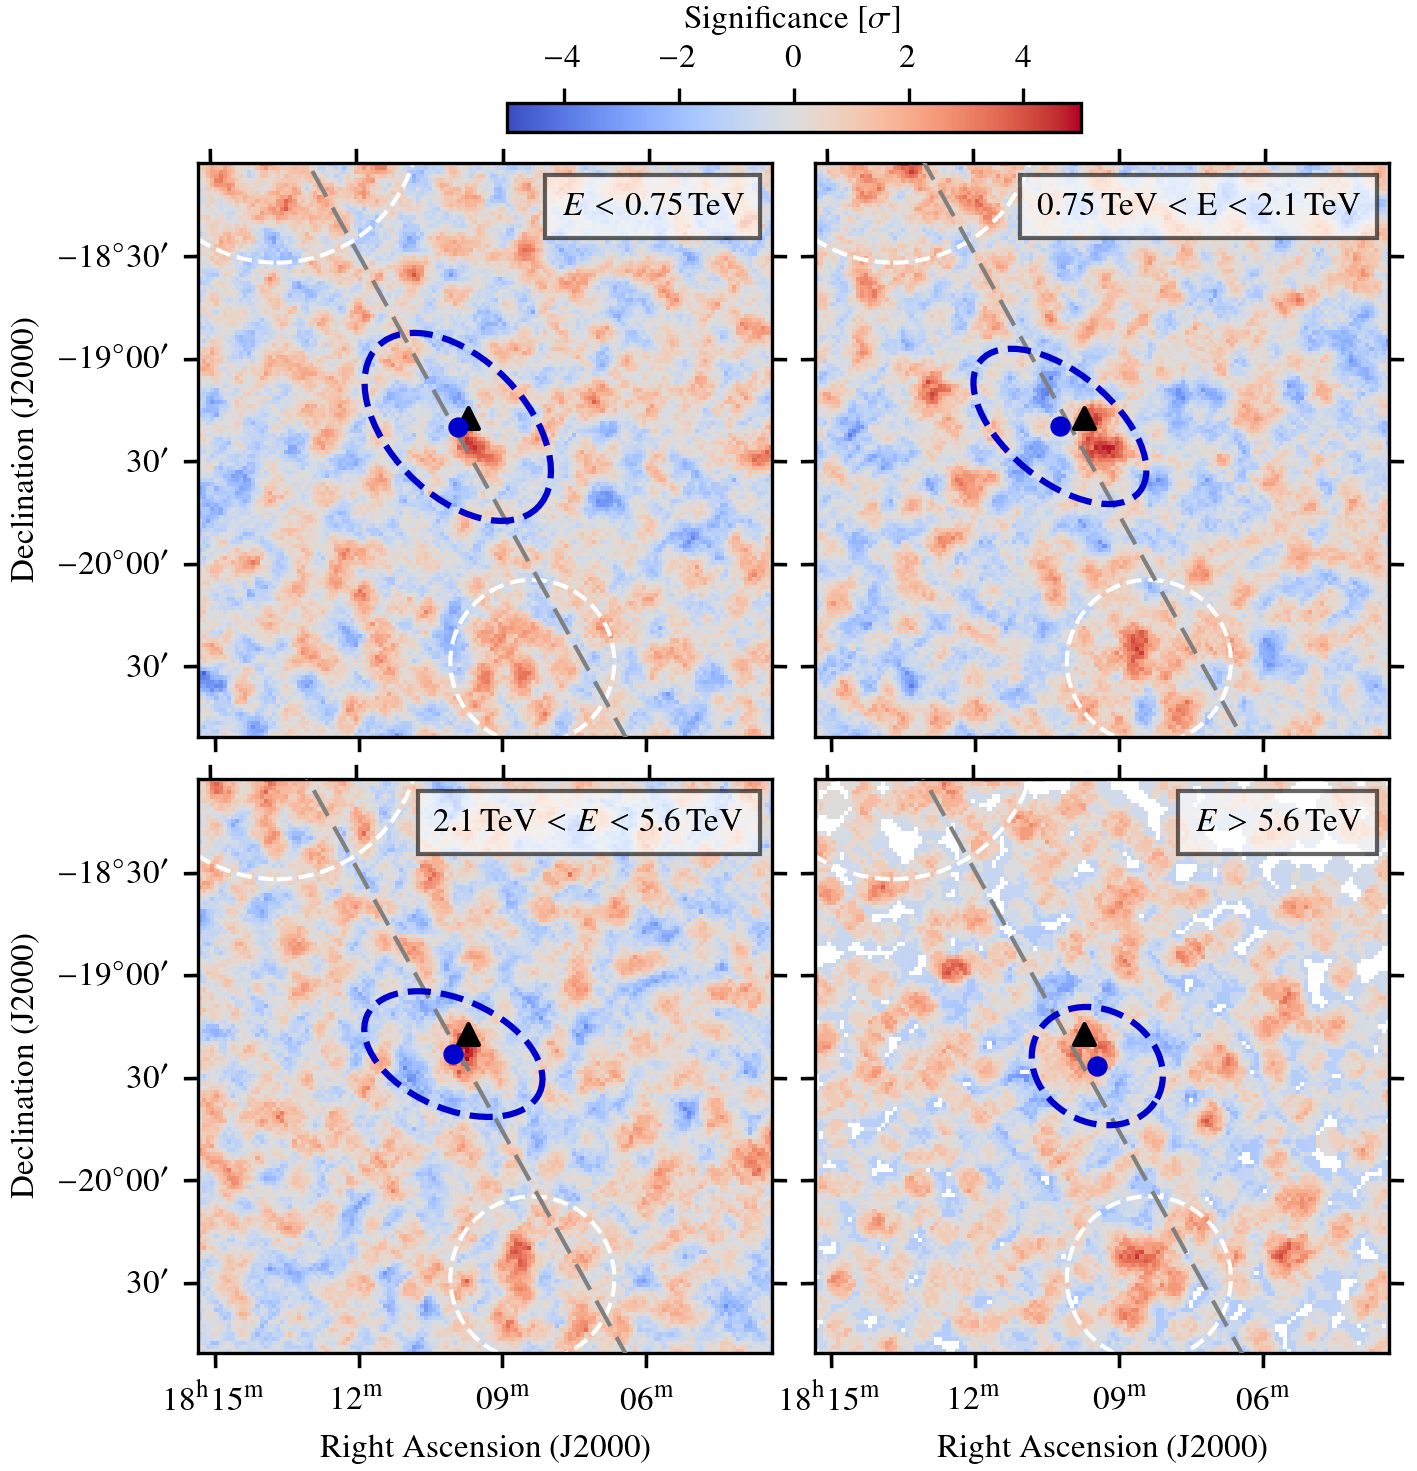
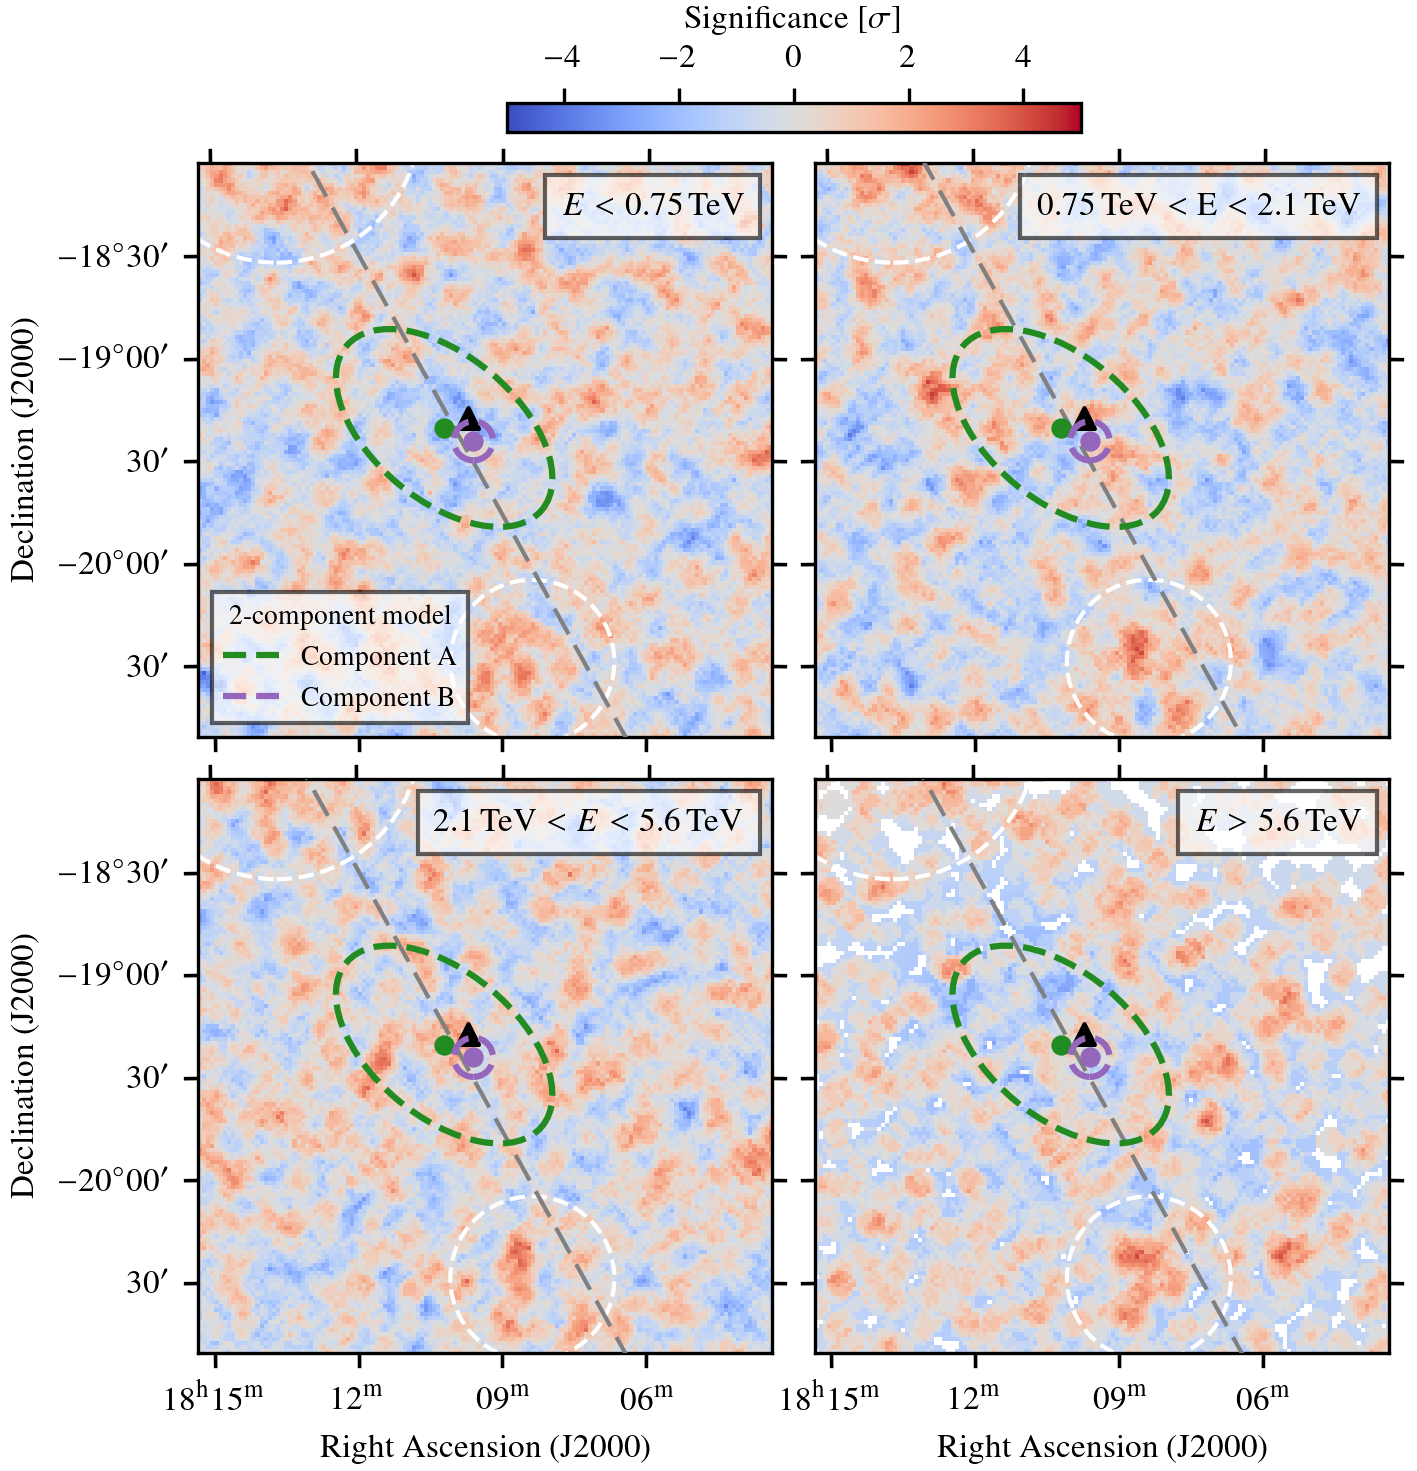
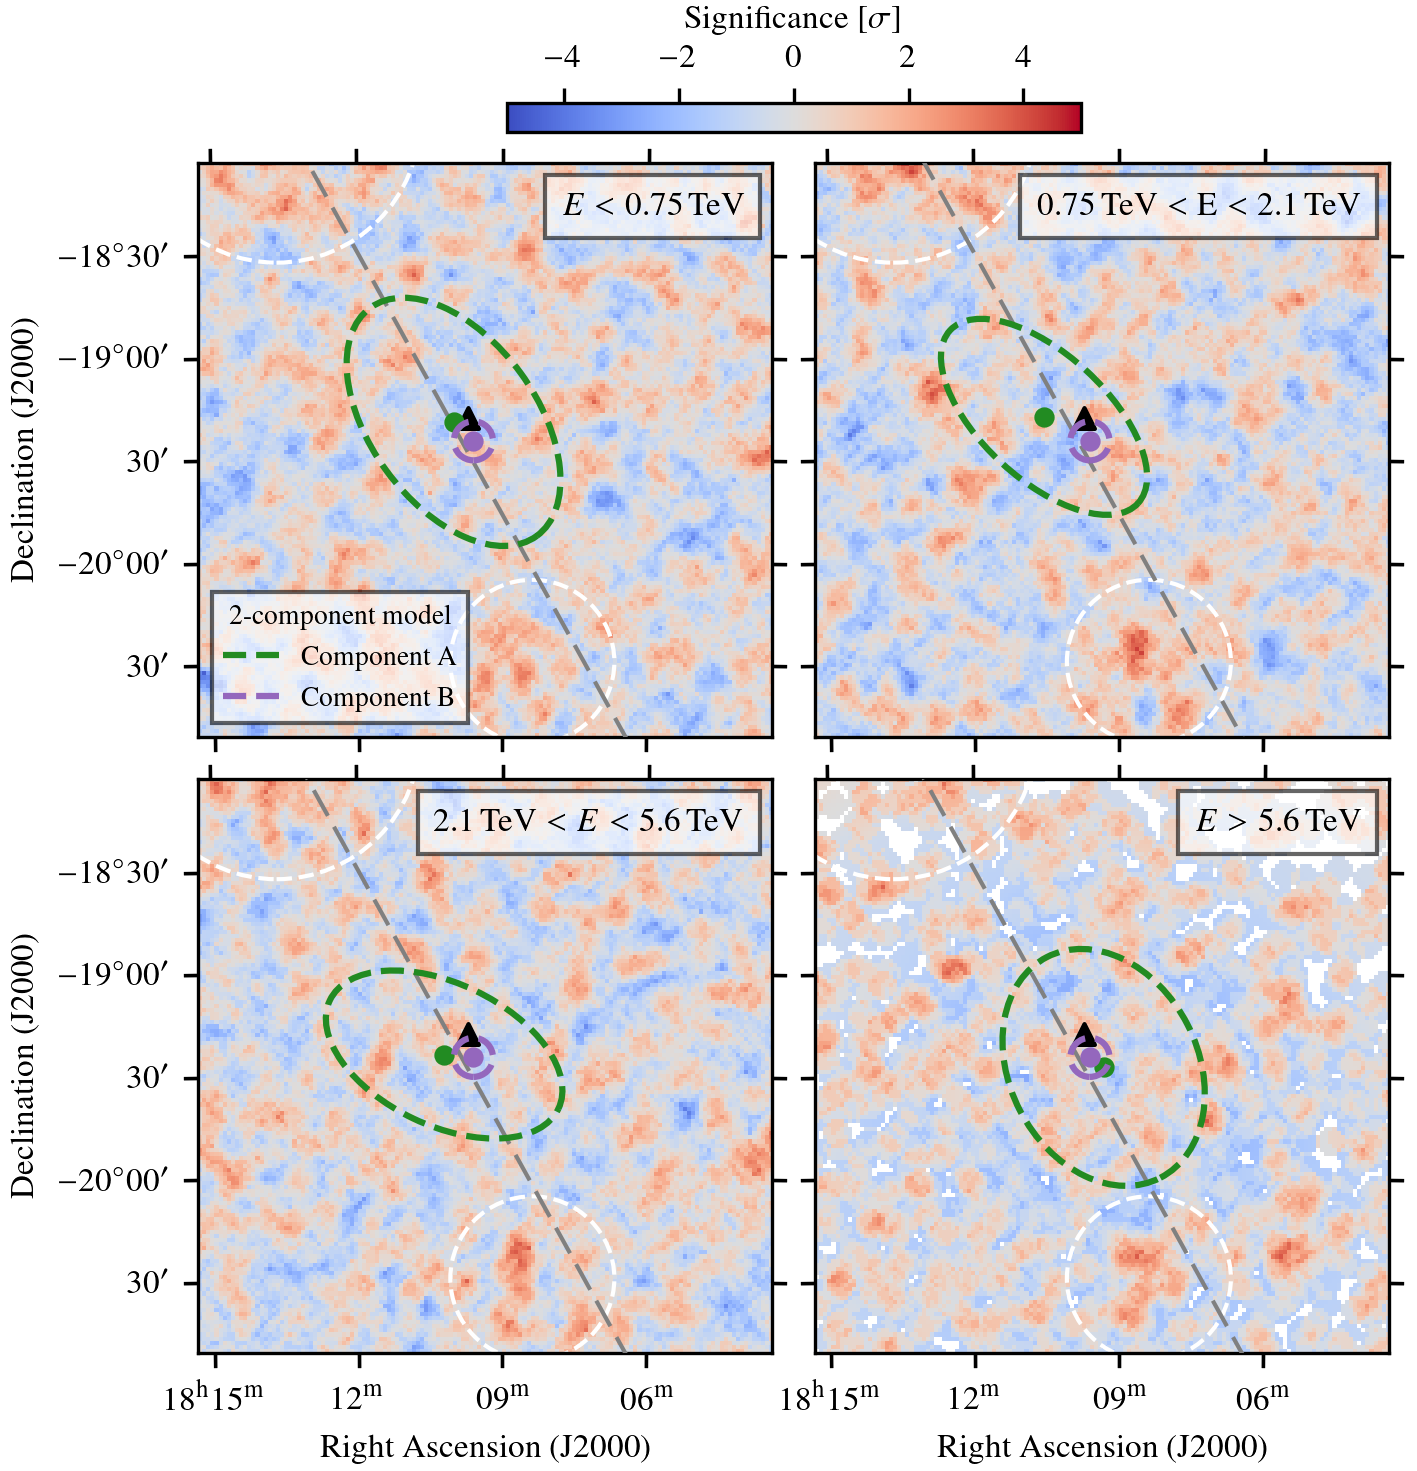
Methods. We analysed 93.2 h of data taken on HESS J1809−193 above 0.27 TeV with the High Energy Stereoscopic System (H.E.S.S.), using a multi-component, three-dimensional likelihood analysis. In addition, we provide a new analysis of 12.5 yr of Fermi-LAT data above 1 GeV within the region of HESS J1809−193. The obtained results are interpreted in a time-dependent modelling framework.

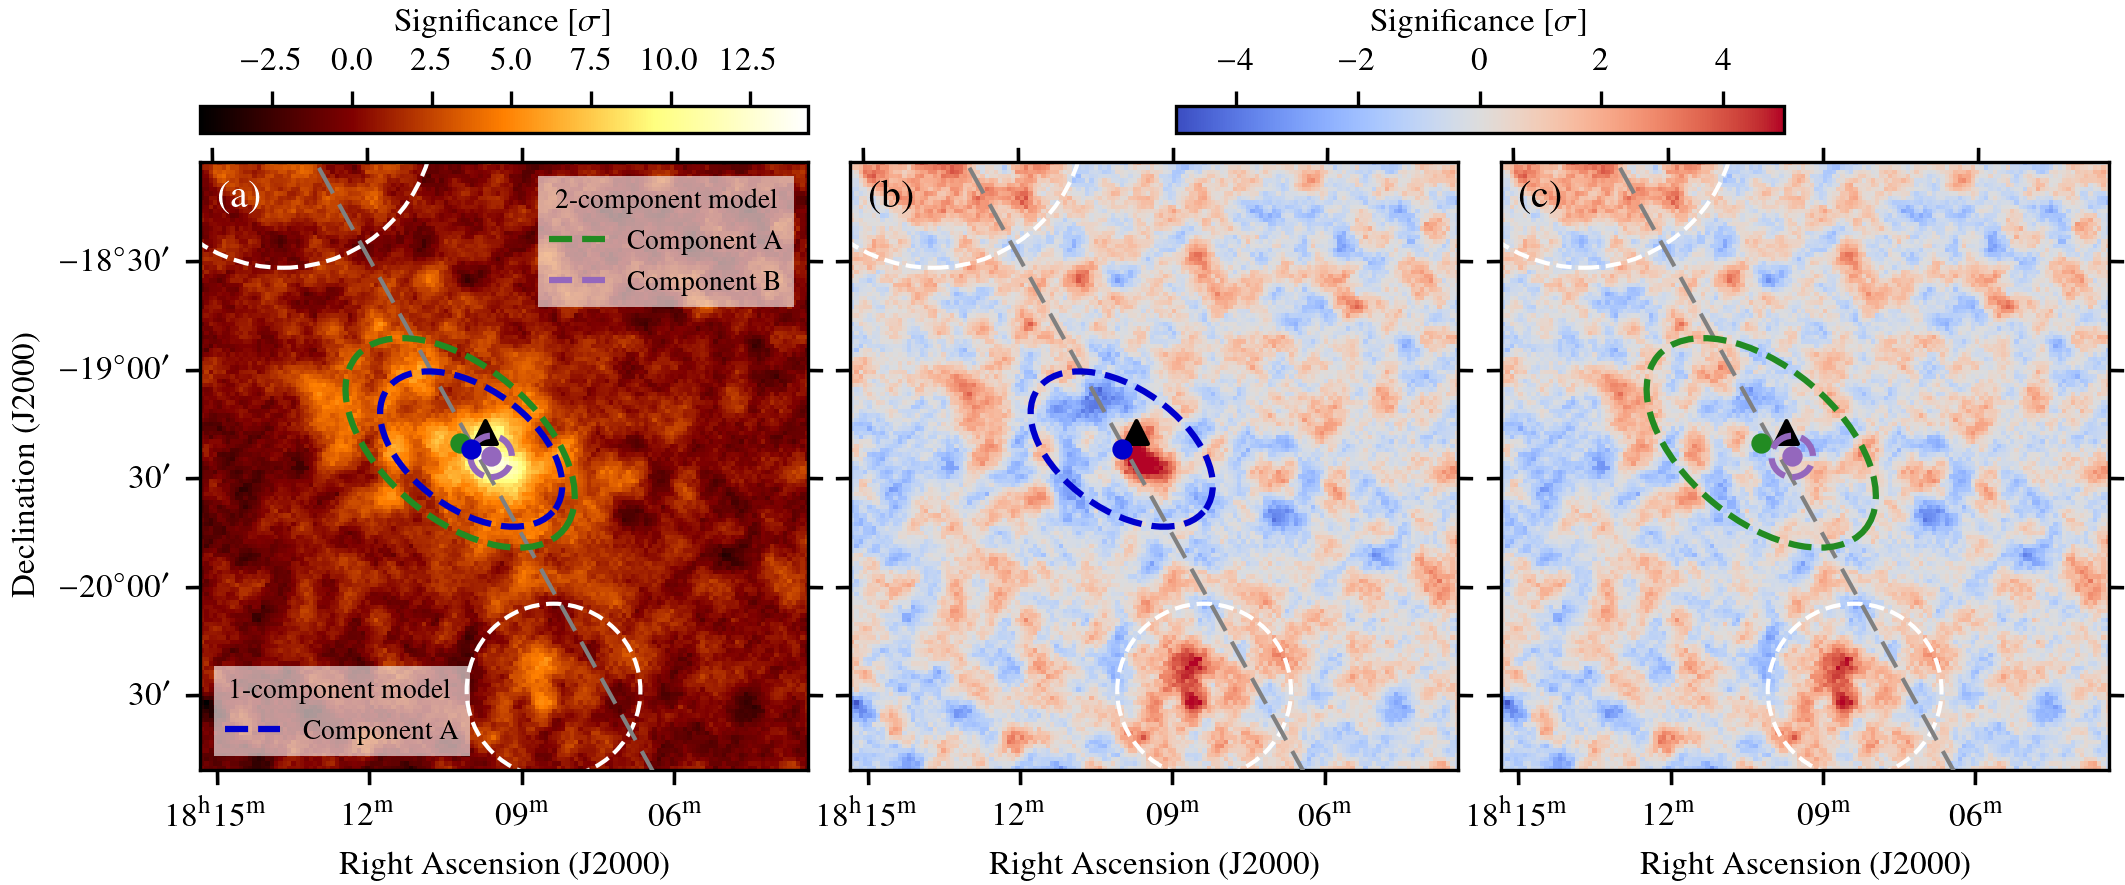
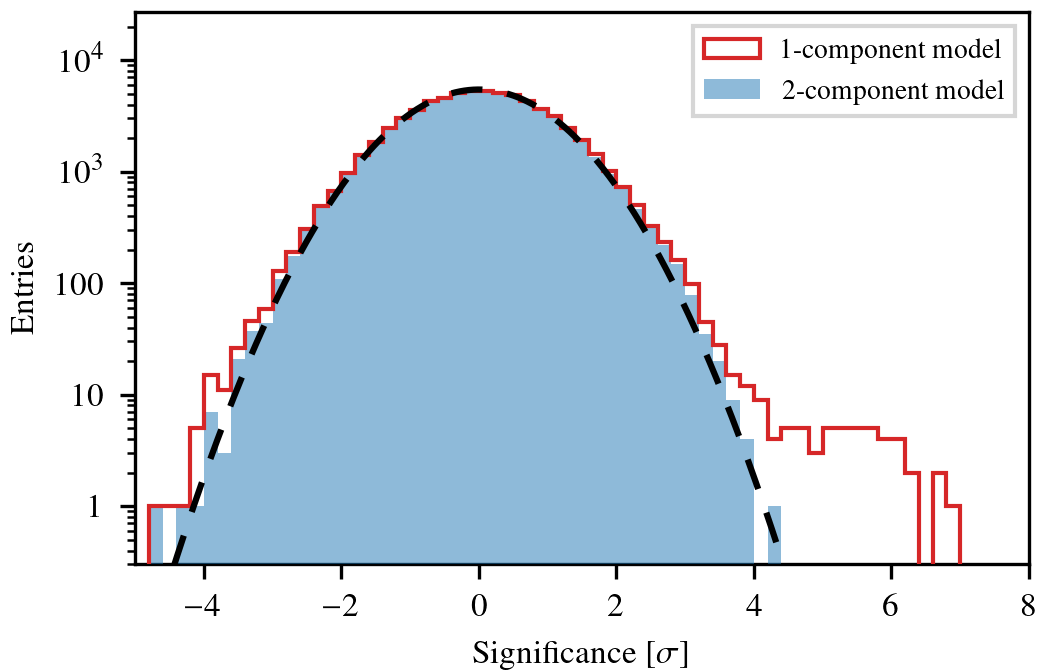
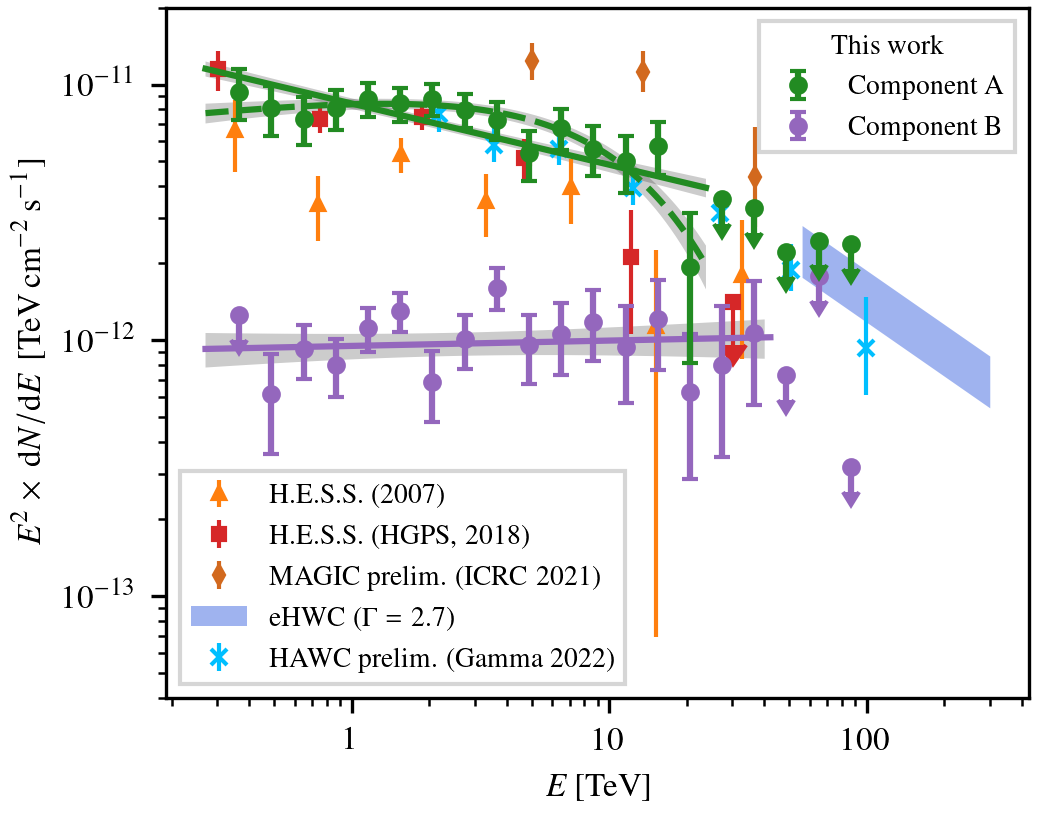
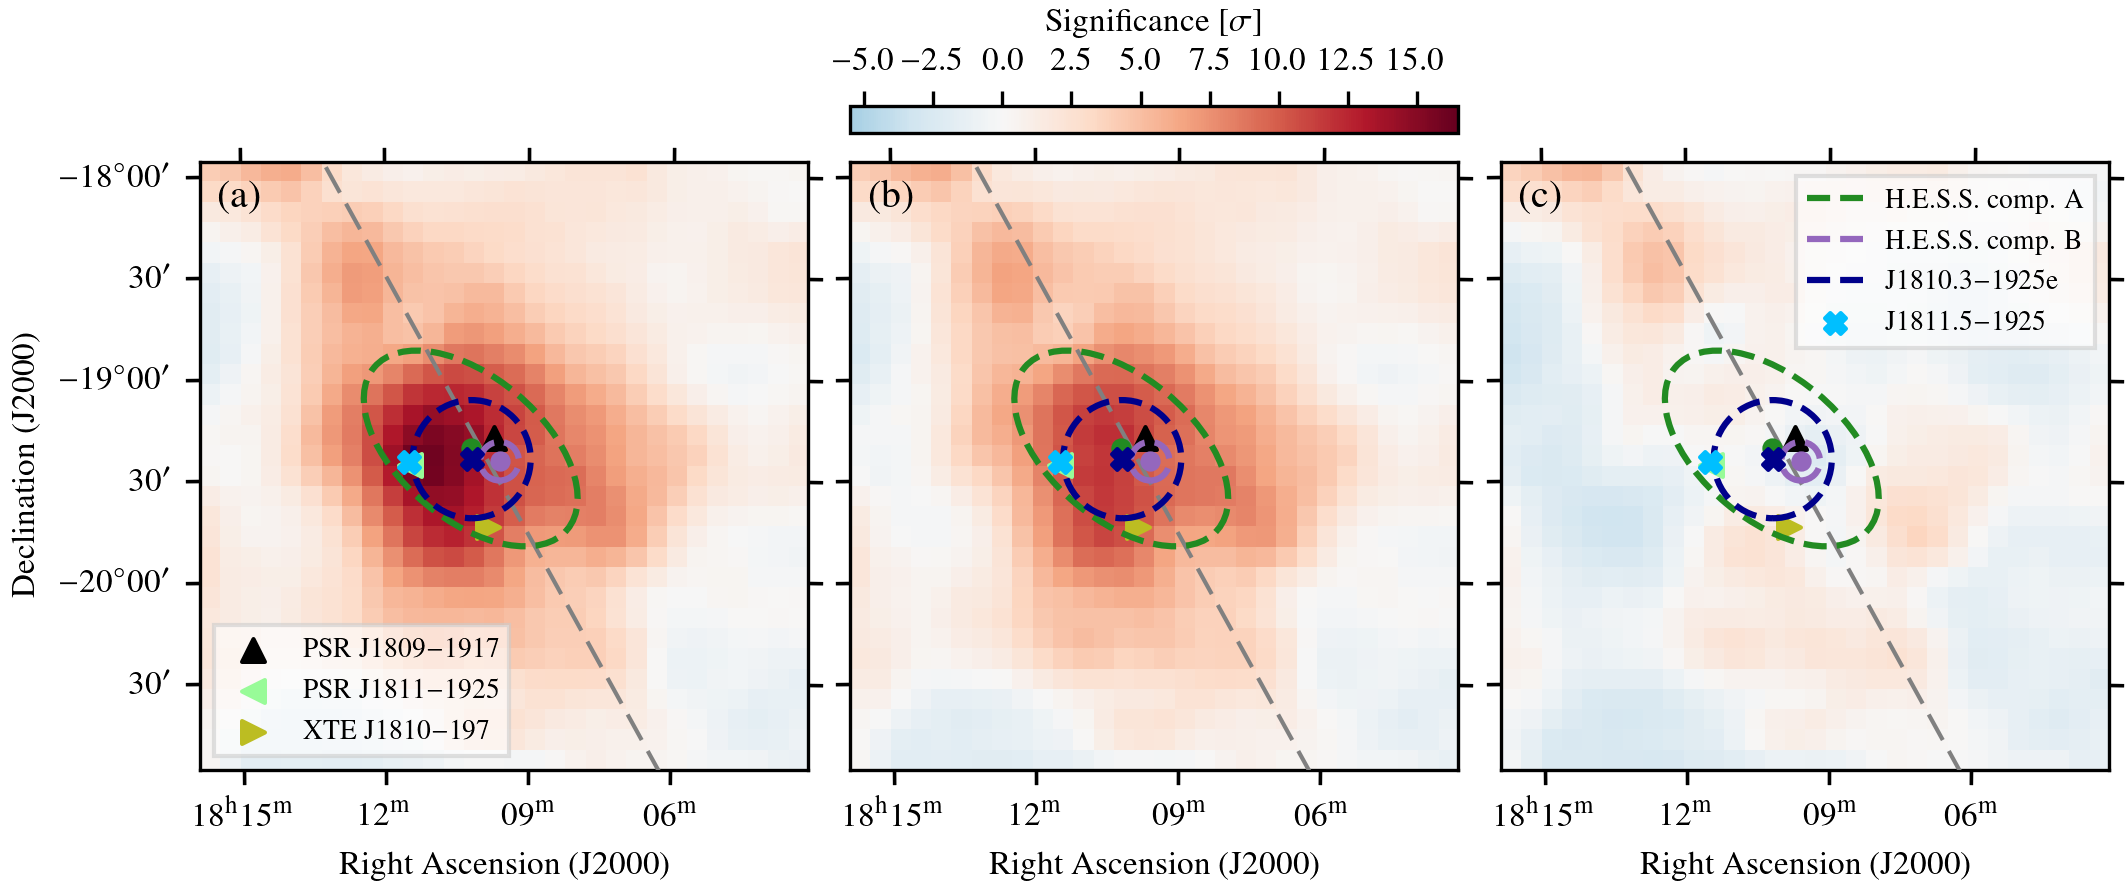
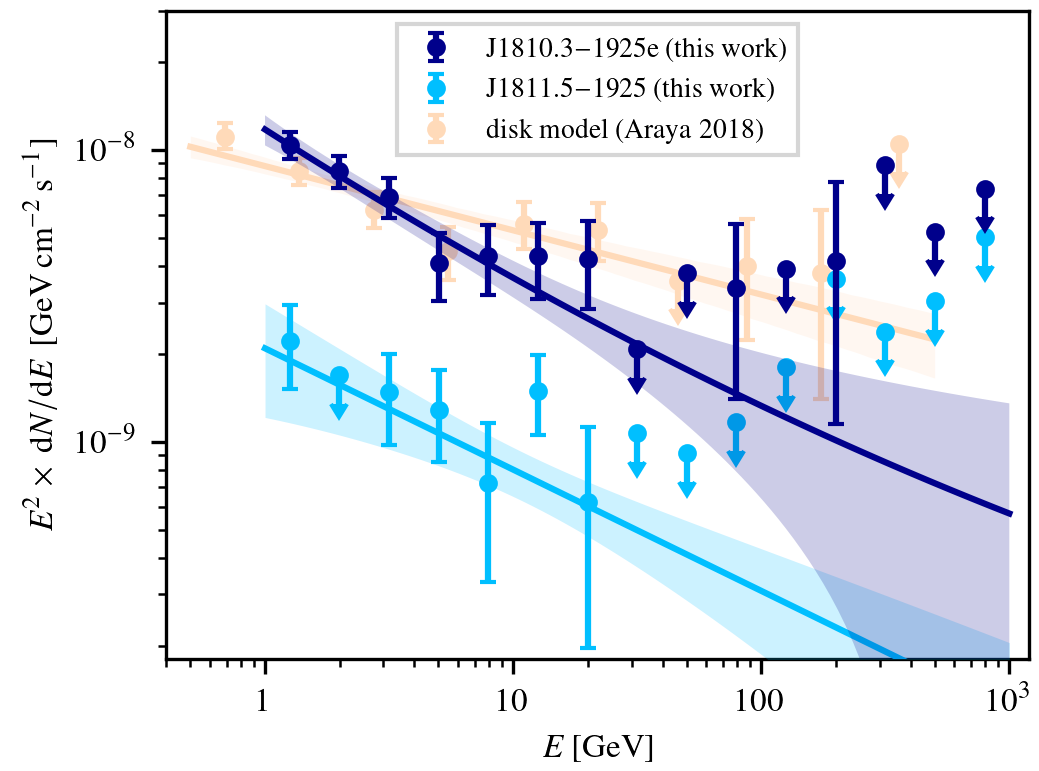
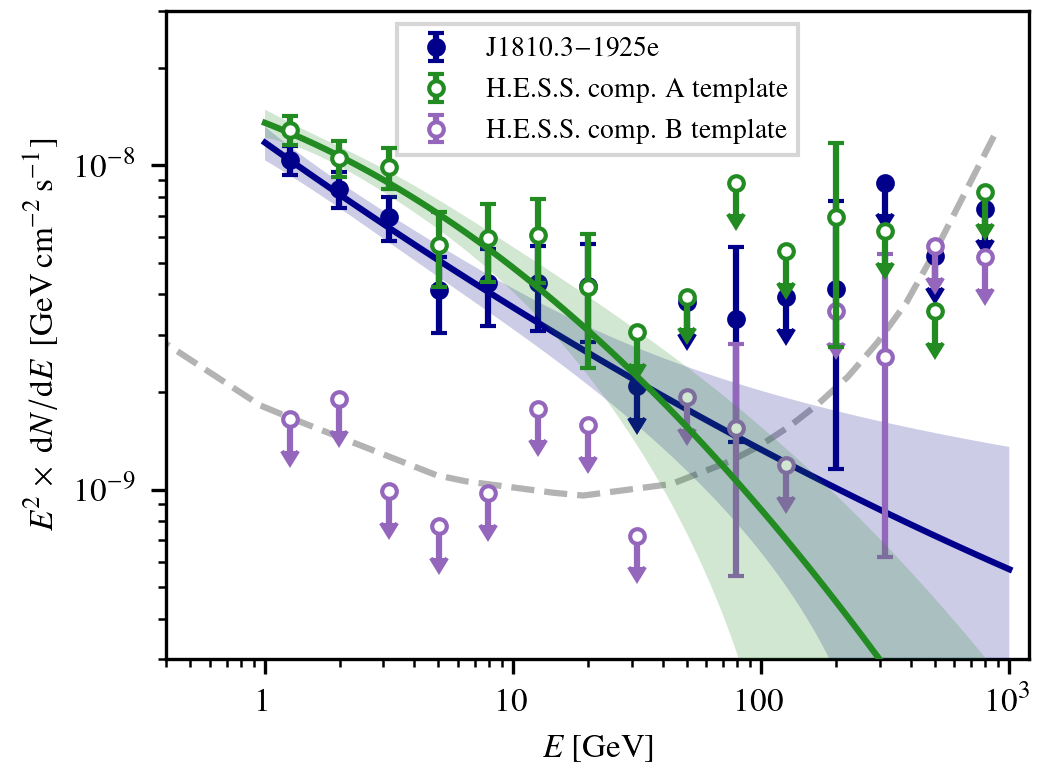
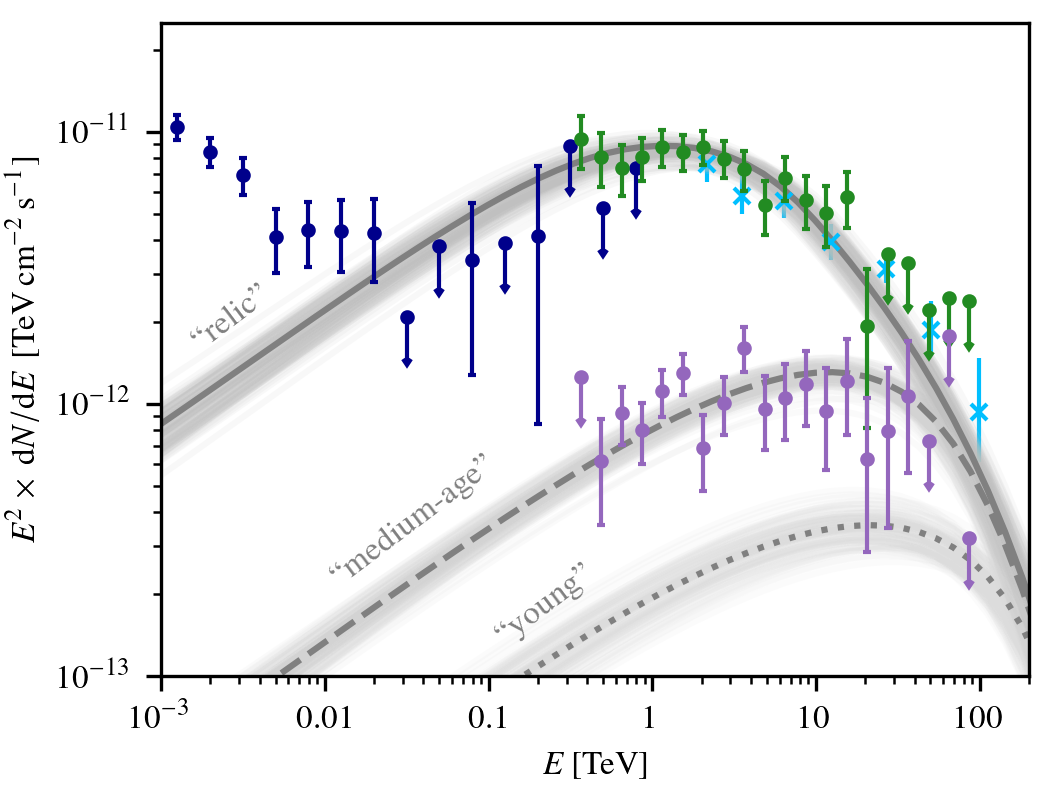
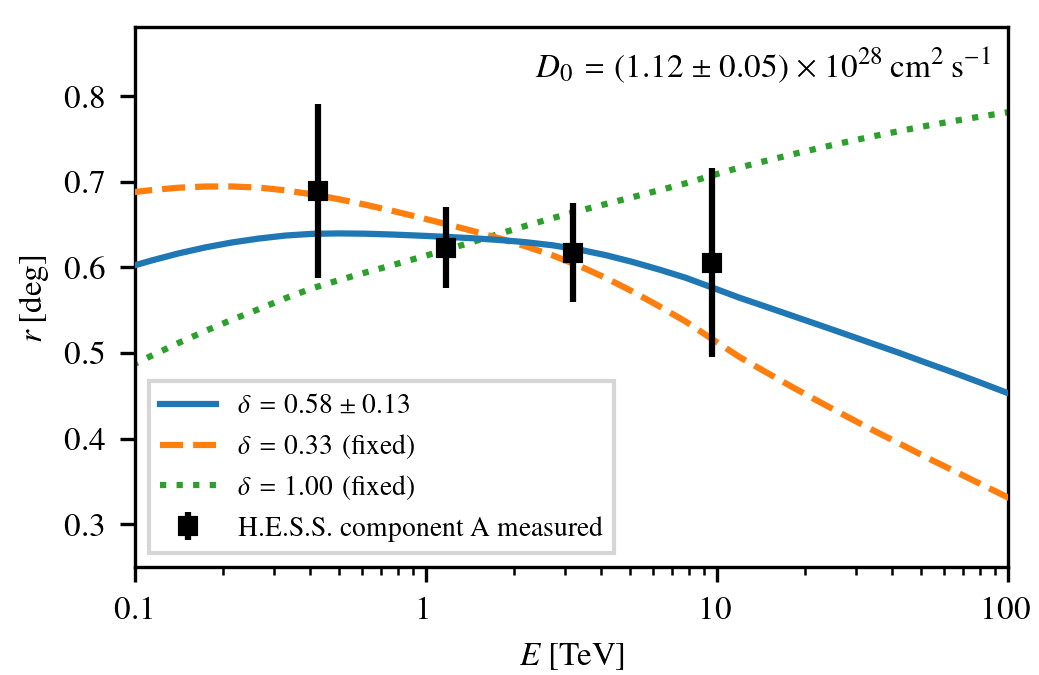
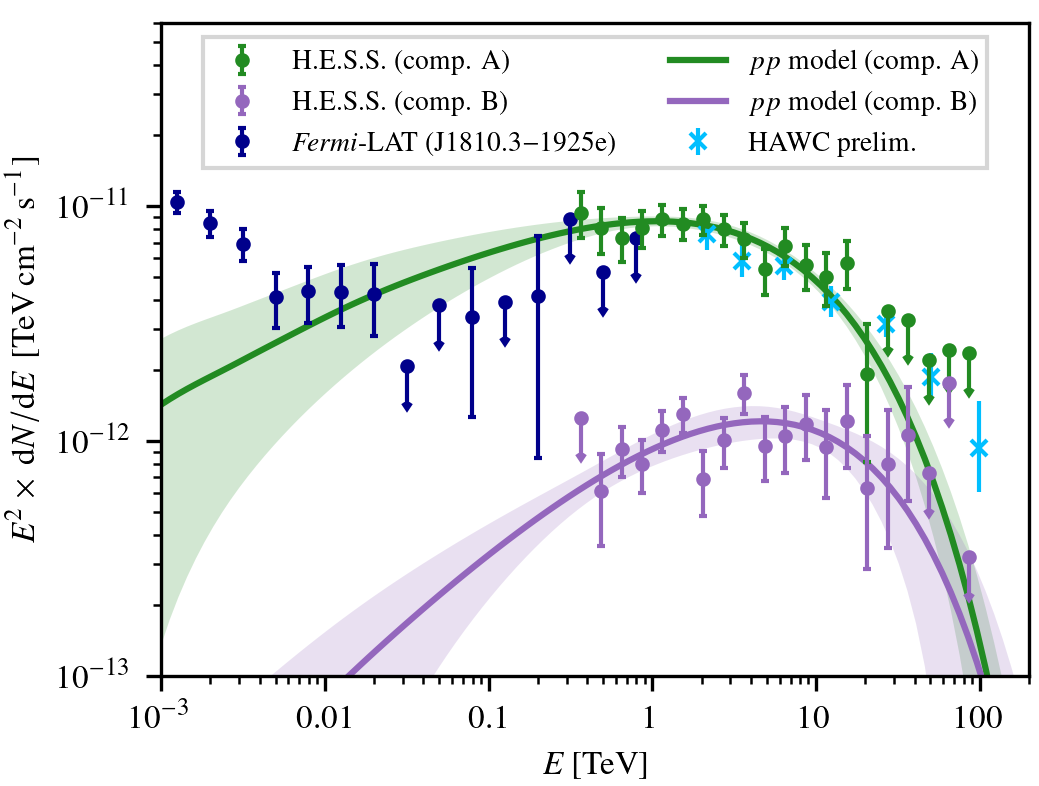
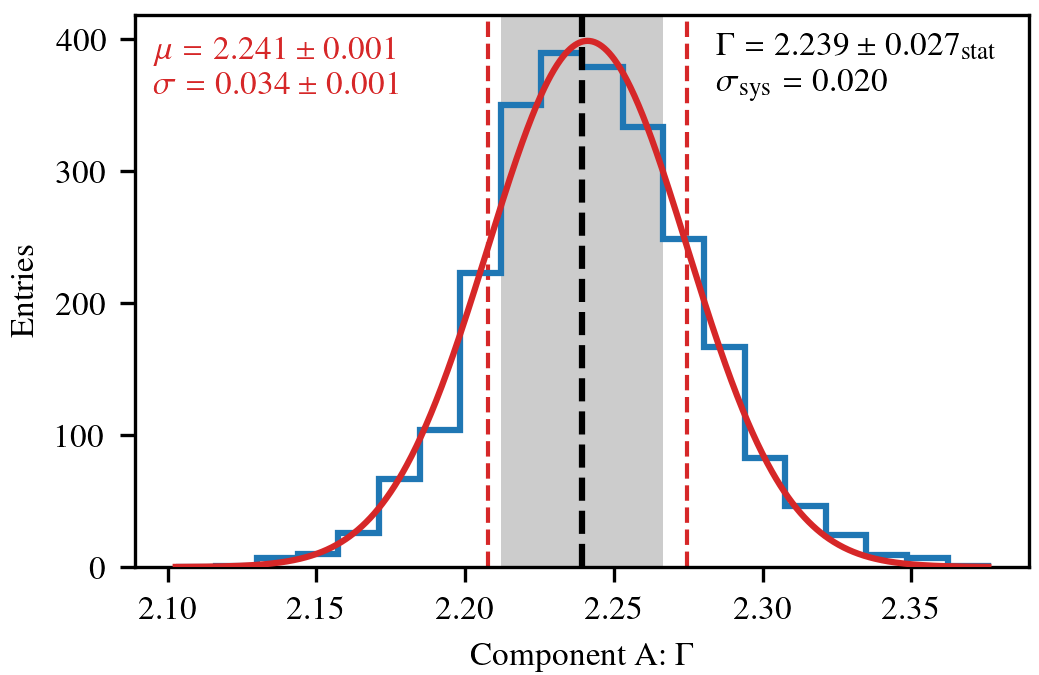
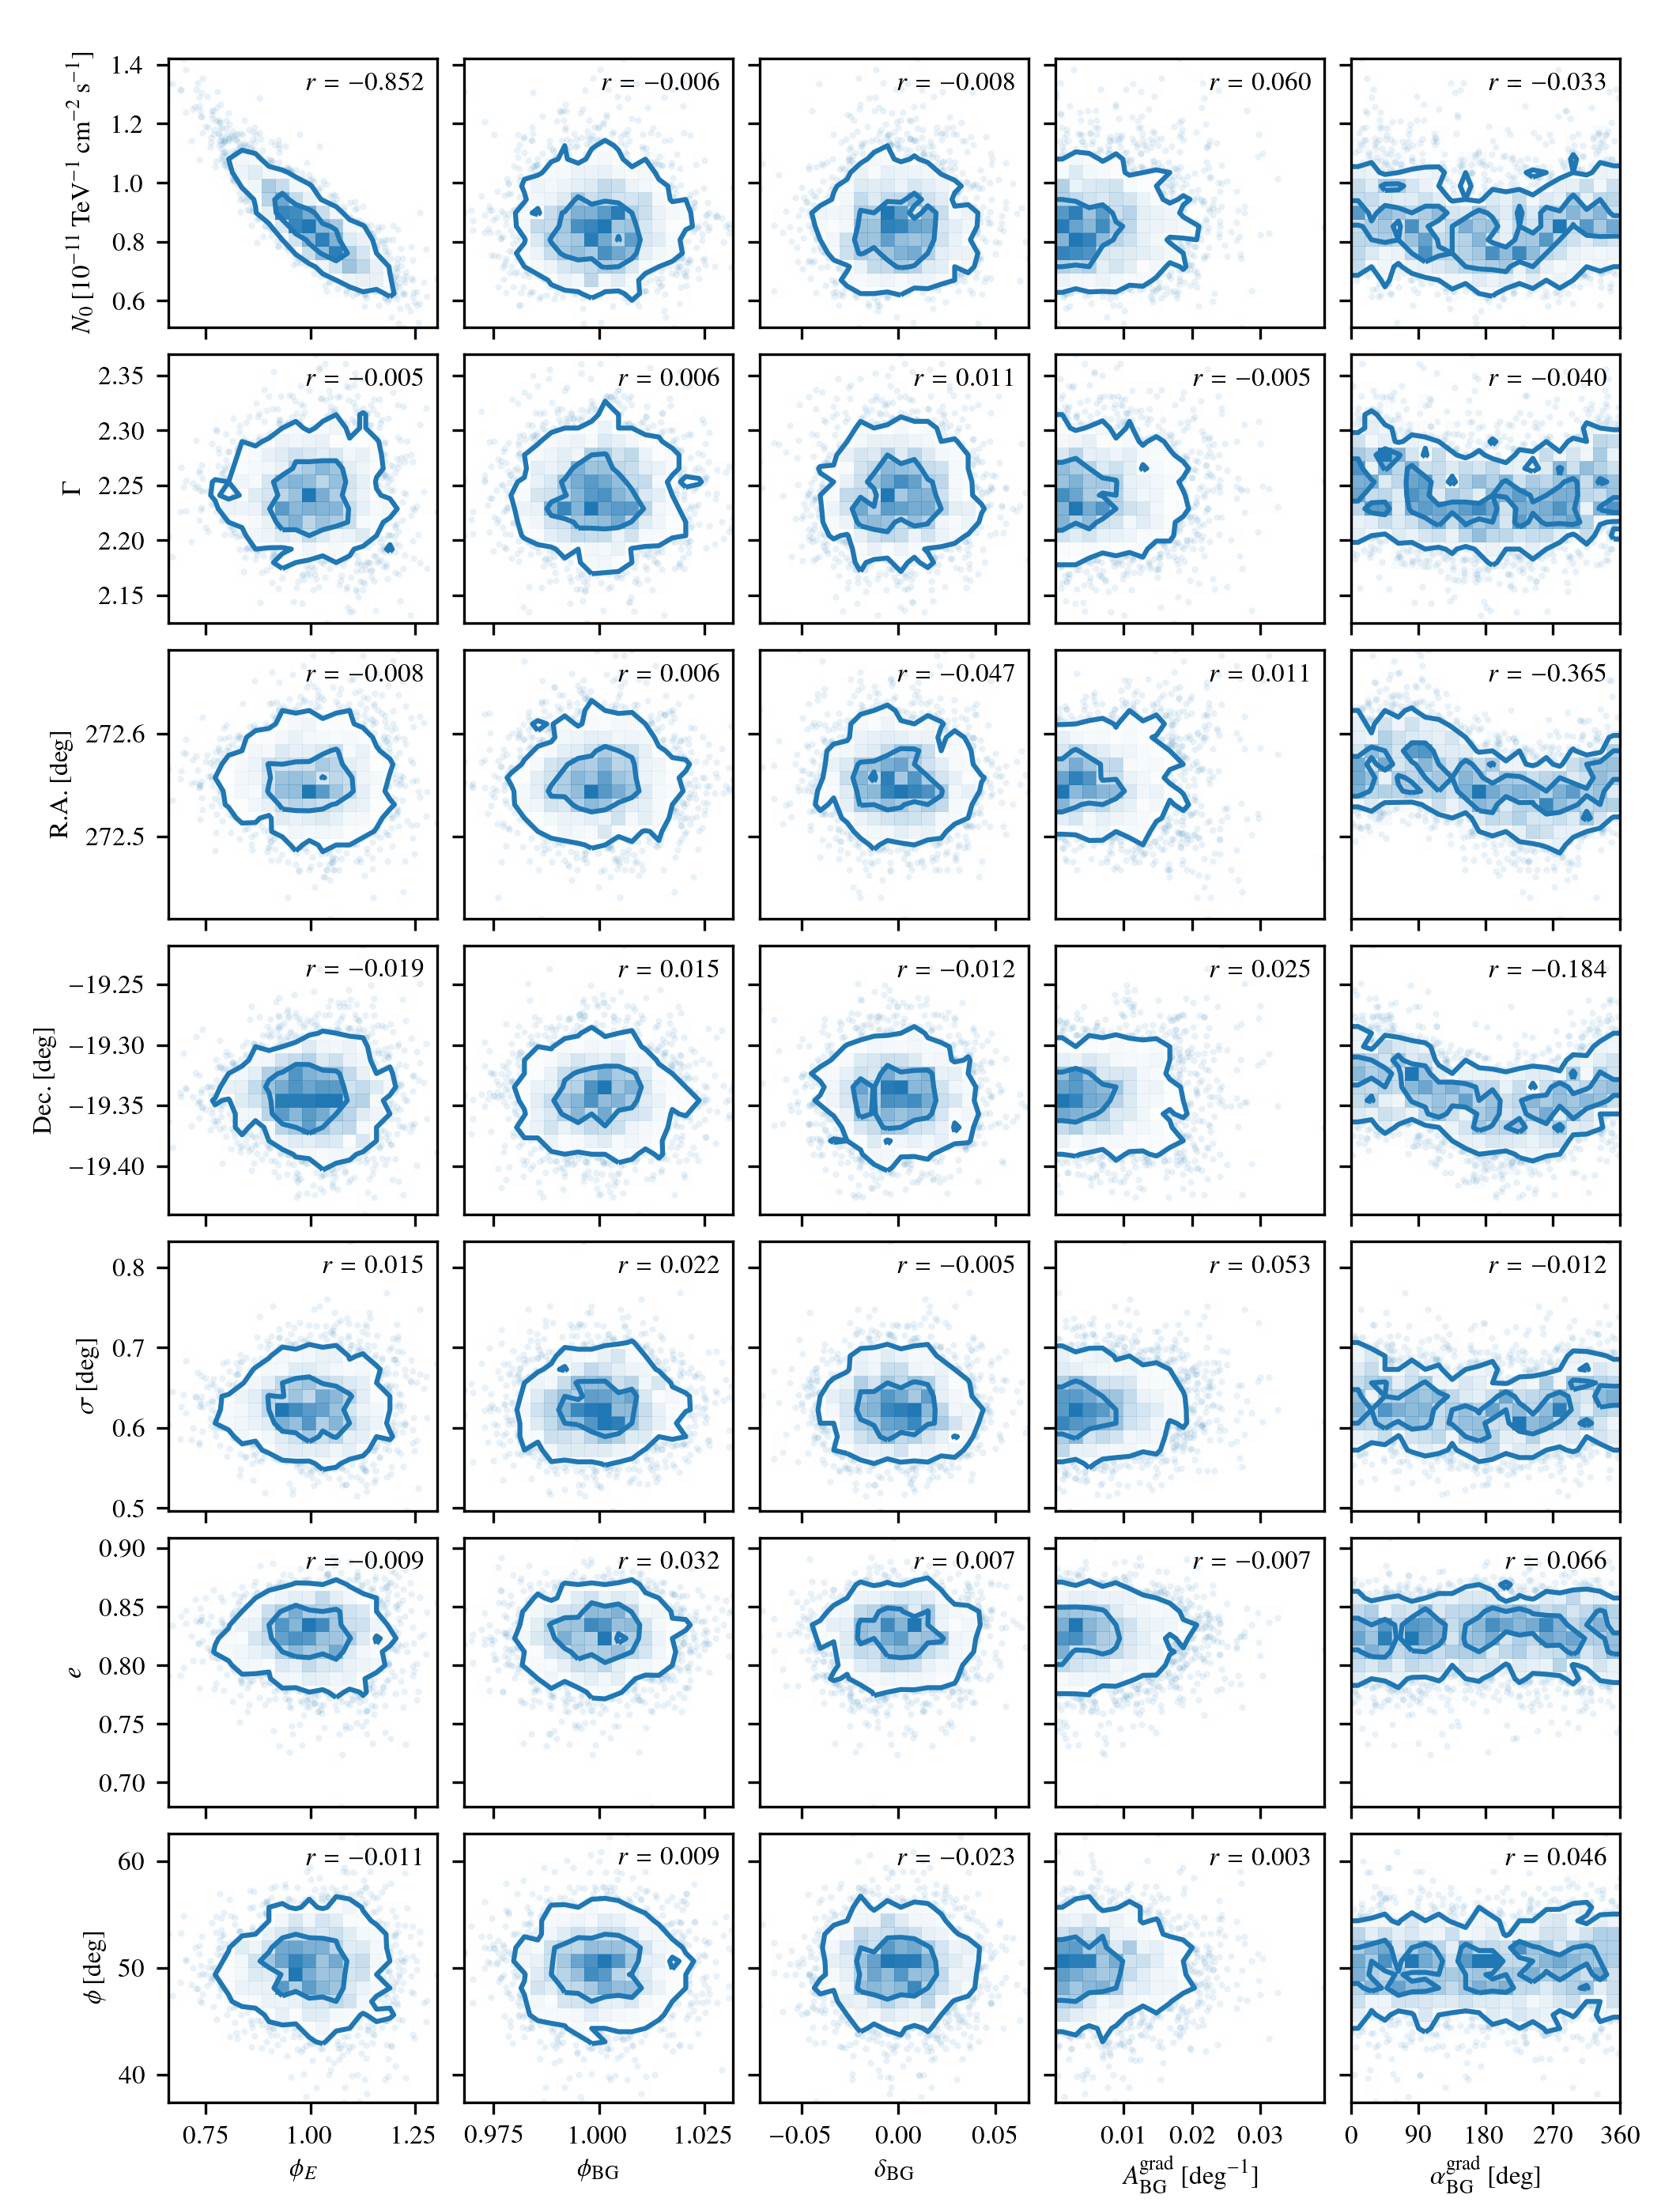
Results. For the first time, we were able to resolve the emission detected with H.E.S.S. into two components: an extended component (modelled as an elongated Gaussian with a 1-σ semi-major and semi-minor axis of ∼0.62° and ∼0.35°, respectively) that exhibits a spectral cutoff at ∼13 TeV, and a compact component (modelled as a symmetric Gaussian with a 1-σ radius of ∼0.1°) that is located close to PSR J1809−1917 and shows no clear spectral cutoff. The Fermi-LAT analysis also revealed extended γ-ray emission, on scales similar to that of the extended H.E.S.S. component.

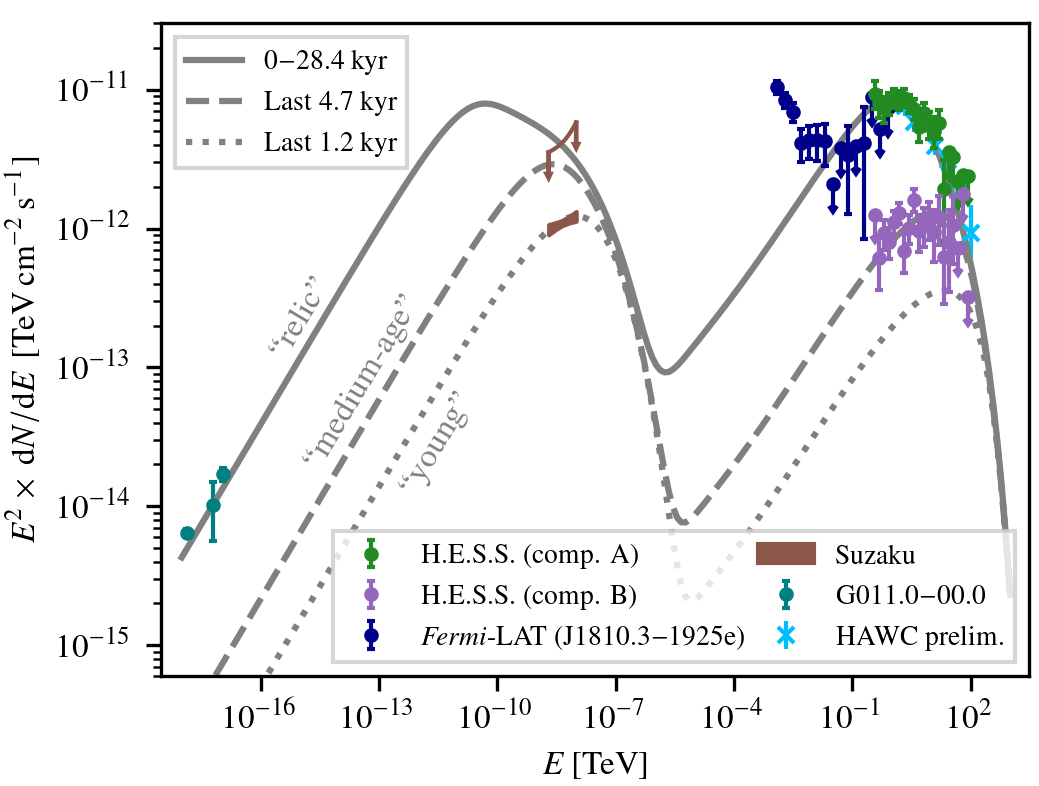
Conclusions. Our modelling indicates that based on its spectrum and spatial extent, the extended H.E.S.S. component is likely caused by inverse Compton emission from old electrons that form a halo around the pulsar wind nebula. The compact component could be connected to either the pulsar wind nebula or the supernova remnant and molecular clouds. Due to its comparatively steep spectrum, modelling the Fermi-LAT emission together with the H.E.S.S. components is not straightforward.

Auxiliary informations

Main paper

Figure 1

Significance maps with best-fit models


[PDF]
[FITS (a)]
[FITS (b)]
[FITS (c)]

Figure 2

Flux maps


[PDF]
[FITS (a)]
[FITS (b)]

Figure 3

Significance distributions


[PDF]

Figure 4

H.E.S.S. energy spectrum results


[PDF]

Flux points: (Errors contain statistical uncertainties and systematic uncertainties, see paper for details. Upper limits are at 95% confidence level.)

ATTENTION: by mistake, the flux values in the table below were given in units of erg cm-2 s-1 instead of TeV cm-2 s-1.
This has been corrected on February 21, 2024.

Component A Component A Component B Component B
Energy [TeV] Energy Flux [TeV cm-2 s-1] Energy Flux Error [TeV cm-2 s-1] Energy Flux [TeV cm-2 s-1] Energy Flux Error [TeV cm-2 s-1]
0.365 9.38e-12 2.09e-12 < 1.25e-12
0.487 8.06e-12 1.79e-12 6.15e-13 2.61e-13
0.649 7.36e-12 1.57e-12 9.22e-13 2.23e-13
0.866 8.06e-12 1.44e-12 8.02e-13 2.05e-13
1.15 8.79e-12 1.36e-12 1.11e-12 2.2e-13
1.54 8.43e-12 1.29e-12 1.3e-12 2.23e-13
2.05 8.78e-12 1.25e-12 6.89e-13 2.14e-13
2.74 7.97e-12 1.24e-12 1.01e-12 2.44e-13
3.65 7.27e-12 1.23e-12 1.61e-12 3.06e-13
4.87 5.38e-12 1.2e-12 9.57e-13 2.92e-13
6.49 6.78e-12 1.26e-12 1.05e-12 3.34e-13
8.66 5.61e-12 1.23e-12 1.18e-12 3.69e-13
11.5 5.01e-12 1.27e-12 9.4e-13 3.94e-13
15.4 5.74e-12 1.35e-12 1.22e-12 4.79e-13
20.5 1.93e-12 1.16e-12 6.29e-13 3.82e-13
27.4 < 3.56e-12 7.98e-13 5.02e-13
36.5 < 3.29e-12 1.06e-12 5.73e-13
48.7 < 2.21e-12 < 7.29e-13
64.9 < 2.45e-12 < 1.78e-12
86.6 < 2.38e-12 < 3.2e-13

Figure 5

Significance maps for Fermi-LAT analysis.


[PDF]
[FITS (a)]
[FITS (b)]
[FITS (c)]

Figure 6

Fermi-LAT energy spectrum results.


[PDF]

Flux points: (Errors contain statistical uncertainties and systematic uncertainties, see paper for details. Upper limits are at 95% confidence level.)

J1810.3-1925e J1810.3-1925e J1810.3-1925e J1811.5-1925 J1811.5-1925 J1811.5-1925
Energy [GeV] Energy Flux [GeV cm-2 s-1] Energy Flux Error Low [GeV cm-2 s-1] Energy Flux Error High [GeV cm-2 s-1] Energy Flux [GeV cm-2 s-1] Energy Flux Error Low [GeV cm-2 s-1] Energy Flux Error High [GeV cm-2 s-1]
1.26 1.04e-08 1.08e-09 1.09e-09 2.22e-09 7.02e-10 7.14e-10
2 8.45e-09 1.05e-09 1.06e-09 < 1.69e-09
3.16 6.92e-09 1.07e-09 1.08e-09 1.48e-09 5.04e-10 5.24e-10
5.01 4.11e-09 1.07e-09 1.09e-09 1.29e-09 4.35e-10 4.66e-10
7.94 4.34e-09 1.15e-09 1.18e-09 7.25e-10 3.95e-10 4.39e-10
12.6 4.33e-09 1.25e-09 1.3e-09 1.49e-09 4.41e-10 4.91e-10
20 4.24e-09 1.39e-09 1.47e-09 6.22e-10 4.25e-10 5.05e-10
31.6 < 2.08e-09 < 1.07e-09
50.1 < 3.79e-09 < 9.13e-10
79.4 3.37e-09 1.96e-09 2.23e-09 < 1.17e-09
126 < 3.92e-09 < 1.8e-09
200 4.15e-09 3e-09 3.62e-09 < 3.63e-09
316 < 8.85e-09 < 2.38e-09
501 < 5.24e-09 < 3.04e-09
794 < 7.36e-09 < 5.01e-09

Figure 7

Fermi-LAT energy spectra for H.E.S.S. component templates.


[PDF]

Flux points: (Errors contain statistical uncertainties and systematic uncertainties, see paper for details. Upper limits are at 95% confidence level.)

Component A template Component A template Component A template Component B template Component B template Component B template
Energy [GeV] Energy Flux [GeV cm-2 s-1] Energy Flux Error Low [GeV cm-2 s-1] Energy Flux Error High [GeV cm-2 s-1] Energy Flux [GeV cm-2 s-1] Energy Flux Error Low [GeV cm-2 s-1] Energy Flux Error High [GeV cm-2 s-1]
1.26 1.29e-08 1.31e-09 1.32e-09 < 1.65e-09
2 1.05e-08 1.33e-09 1.34e-09 < 1.9e-09
3.16 9.87e-09 1.41e-09 1.43e-09 < 9.87e-10
5.01 5.68e-09 1.47e-09 1.49e-09 < 7.73e-10
7.94 5.97e-09 1.6e-09 1.63e-09 < 9.76e-10
12.6 6.09e-09 1.75e-09 1.8e-09 < 1.78e-09
20 4.21e-09 1.84e-09 1.94e-09 < 1.58e-09
31.6 < 3.06e-09 < 7.22e-10
50.1 < 3.94e-09 < 1.93e-09
79.4 < 8.84e-09 1.55e-09 1.01e-09 1.27e-09
126 < 5.44e-09 < 1.19e-09
200 6.92e-09 4.17e-09 4.82e-09 < 3.54e-09
316 < 6.26e-09 2.56e-09 1.94e-09 2.78e-09
501 < 3.56e-09 < 5.63e-09
794 < 8.28e-09 < 5.21e-09

Figure 8

SEDs for leptonic model.

(a) [PDF] (b) [PDF]

Figure 9

Measured and predicted radius of component A.


[PDF]

Figure 10

SED for hadronic model.


[PDF]

Appendices

Figure A.1

Distributions of fitted background model parameters.


[PDF]

Figure A.2

Significance map after background model fit.


[PDF] [FITS]

Figure A.3

Significance distributions after background model fit.


[PDF]

Figure B.1

Source parameter distributions including systematic effects.

(a) [PDF] (b) [PDF]

Figure B.2

Correlations between source model parameters and systematic variation parameters.


[PDF]

Figure C.1

Residual significance maps for 1-component model fitted in energy bands.


[PDF]
[FITS 1]
[FITS 2]
[FITS 3]
[FITS 4]

Figure C.2

Residual significance maps for broadband-fit of 2-component model.


[PDF]
[FITS 1]
[FITS 2]
[FITS 3]
[FITS 4]

Figure C.3

Residual significance maps for 2-component model fitted in energy bands.


[PDF]
[FITS 1]
[FITS 2]
[FITS 3]
[FITS 4]

Collaboration Acknowledgement

The support of the Namibian authorities and of the University of Namibia in facilitating the construction and operation of H.E.S.S. is gratefully acknowledged, as is the support by the German Ministry for Education and Research (BMBF), the Max Planck Society, the German Research Foundation (DFG), the Helmholtz Association, the Alexander von Humboldt Foundation, the French Ministry of Higher Education, Research and Innovation, the Centre National de la Recherche Scientifique (CNRS/IN2P3 and CNRS/INSU), the Commissariat à l’Énergie atomique et aux Énergies alternatives (CEA), the U.K. Science and Technology Facilities Council (STFC), the Irish Research Council (IRC) and the Science Foundation Ireland (SFI), the Knut and Alice Wallenberg Foundation, the Polish Ministry of Education and Science, agreement no. 2021/WK/06, the South African Department of Science and Technology and National Research Foundation, the University of Namibia, the National Commission on Research, Science & Technology of Namibia (NCRST), the Austrian Federal Ministry of Education, Science and Research and the Austrian Science Fund (FWF), the Australian Research Council (ARC), the Japan Society for the Promotion of Science, the University of Amsterdam and the Science Committee of Armenia grant 21AG-1C085. We appreciate the excellent work of the technical support staff in Berlin, Zeuthen, Heidelberg, Palaiseau, Paris, Saclay, Tübingen and in Namibia in the construction and operation of the equipment. This work benefited from services provided by the H.E.S.S. Virtual Organisation, supported by the national resource providers of the EGI Federation.