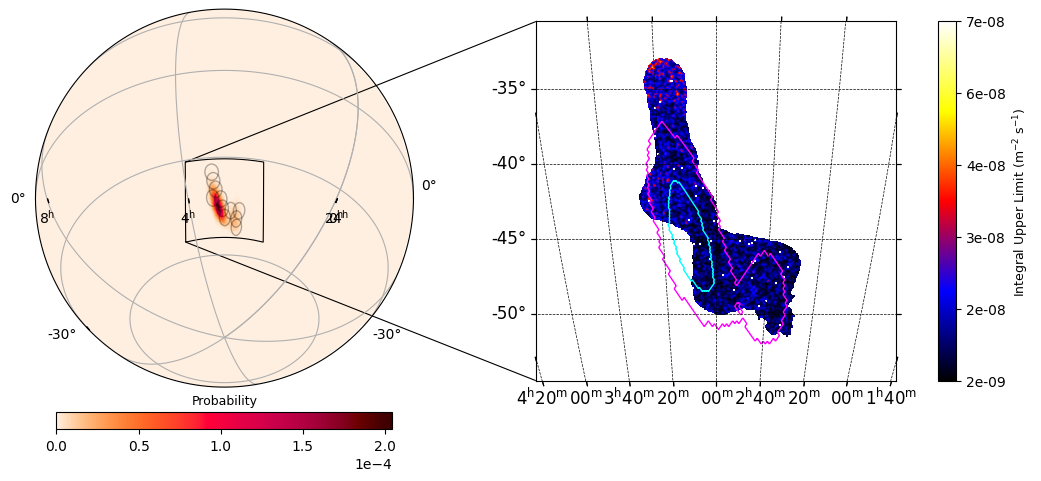
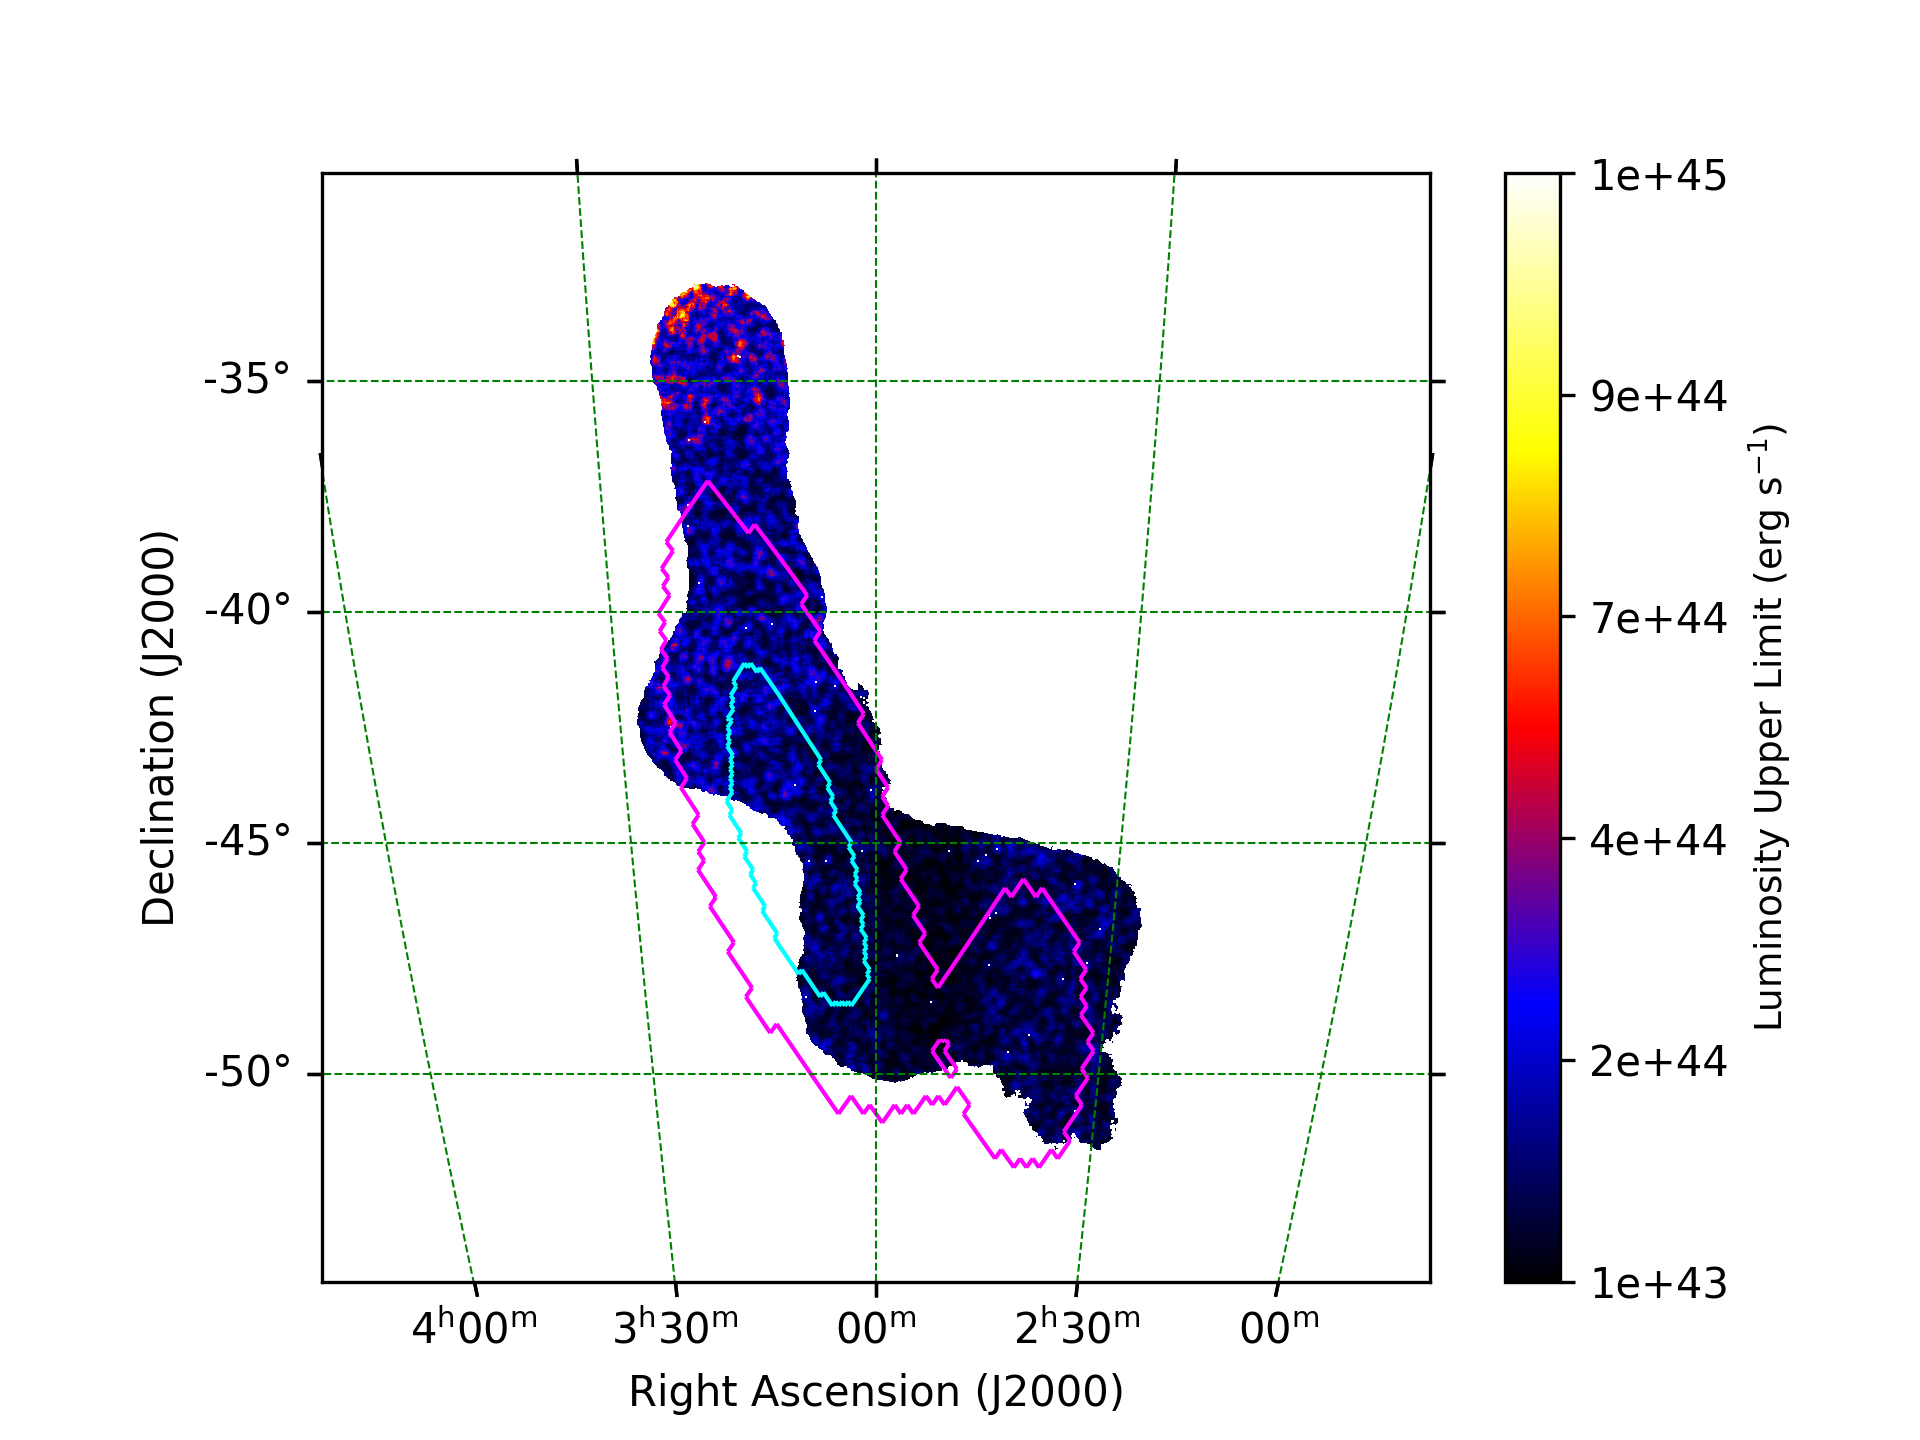
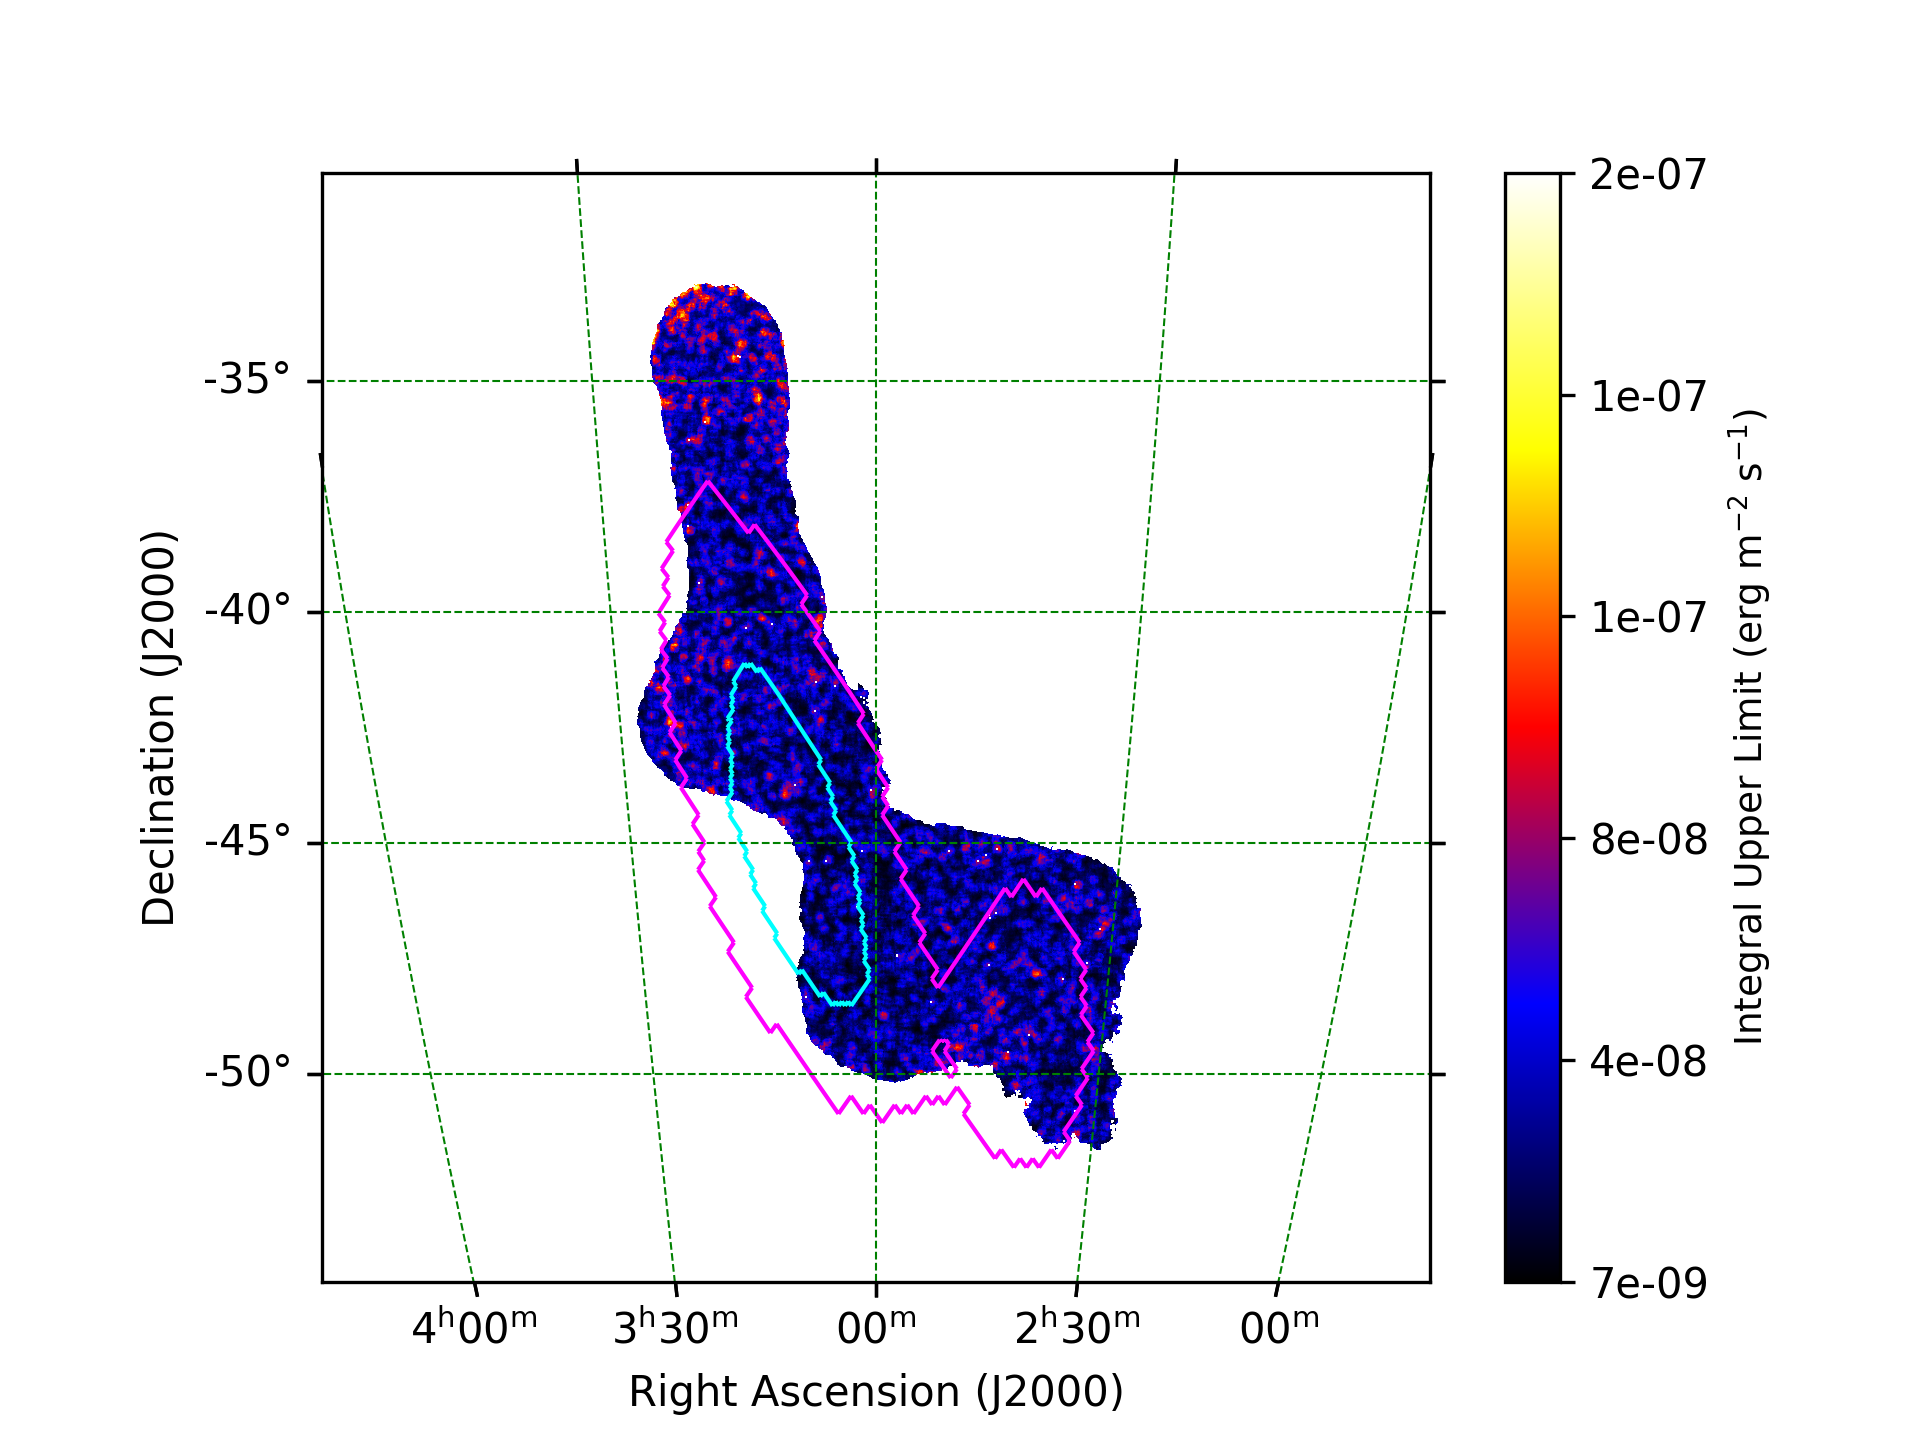
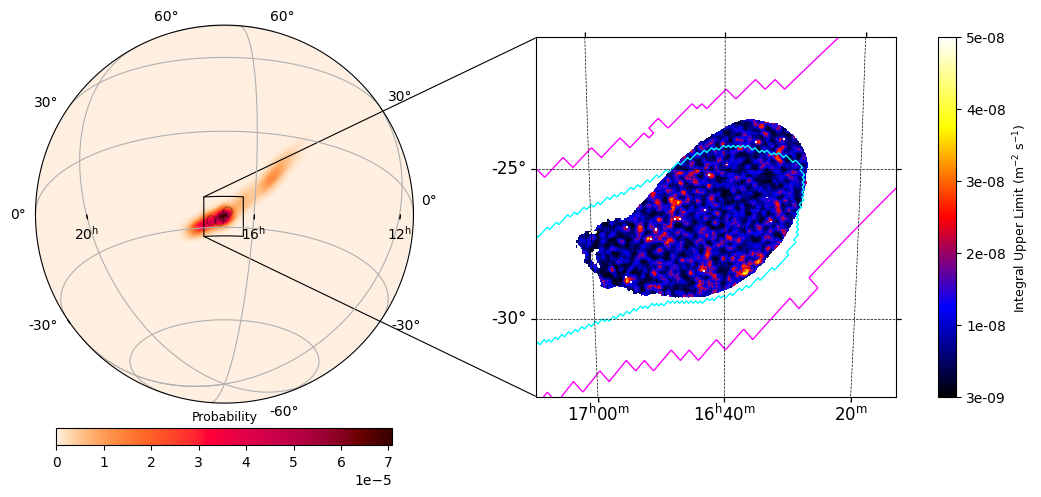
We report on the observations of four well-localized binary black hole (BBH) mergers by the High Energy Stereoscopic System (H.E.S.S.) during the second and third observing runs of Advanced LIGO and Advanced Virgo, O2 and O3. H.E.S.S. can observe 20 deg2 of the sky at a time and follows up gravitational-wave (GW) events by “tiling” localization regions to maximize the covered localization probability. During O2 and O3, H.E.S.S. observed large portions of the localization regions, between 35% and 75%, for four BBH mergers (GW170814, GW190512_180714, GW190728_064510, and S200224ca). For these four GW events, we find no significant signal from a pointlike source in any of the observations, and we set upper limits on the very high energy (>100 GeV) γ-ray emission. The 1–10 TeV isotropic luminosity of these GW events is below 1045 erg s−1 at the times of the H.E.S.S. observations, around the level of the low-luminosity GRB 190829A. Assuming no changes are made to how follow-up observations are conducted, H.E.S.S. can expect to observe over 60 GW events per year in the fourth GW observing run, O4, of which eight would be observable with minimal latency.

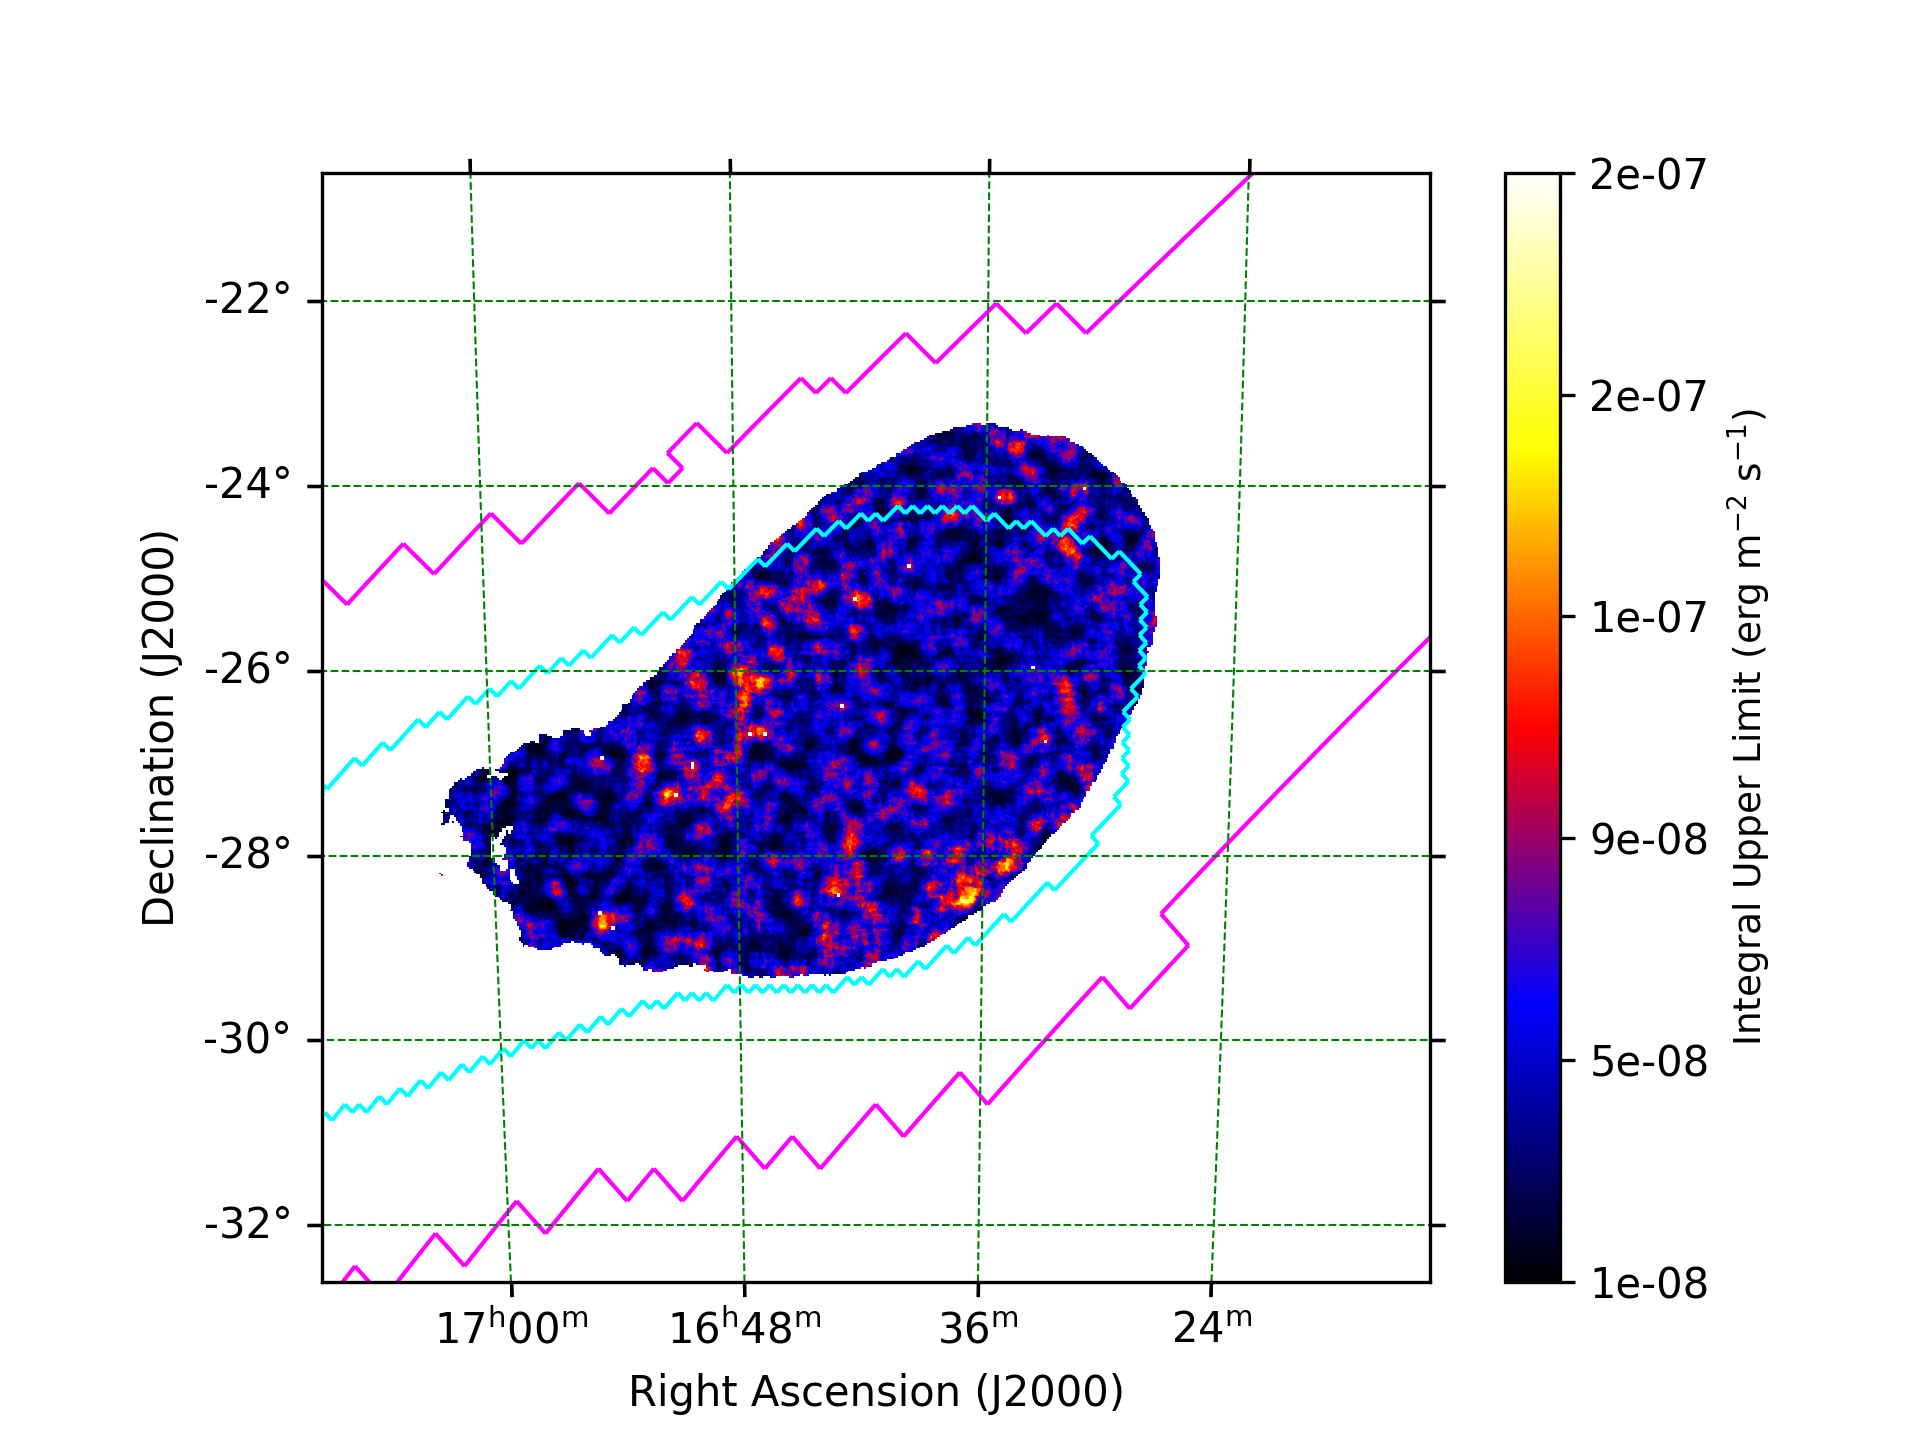
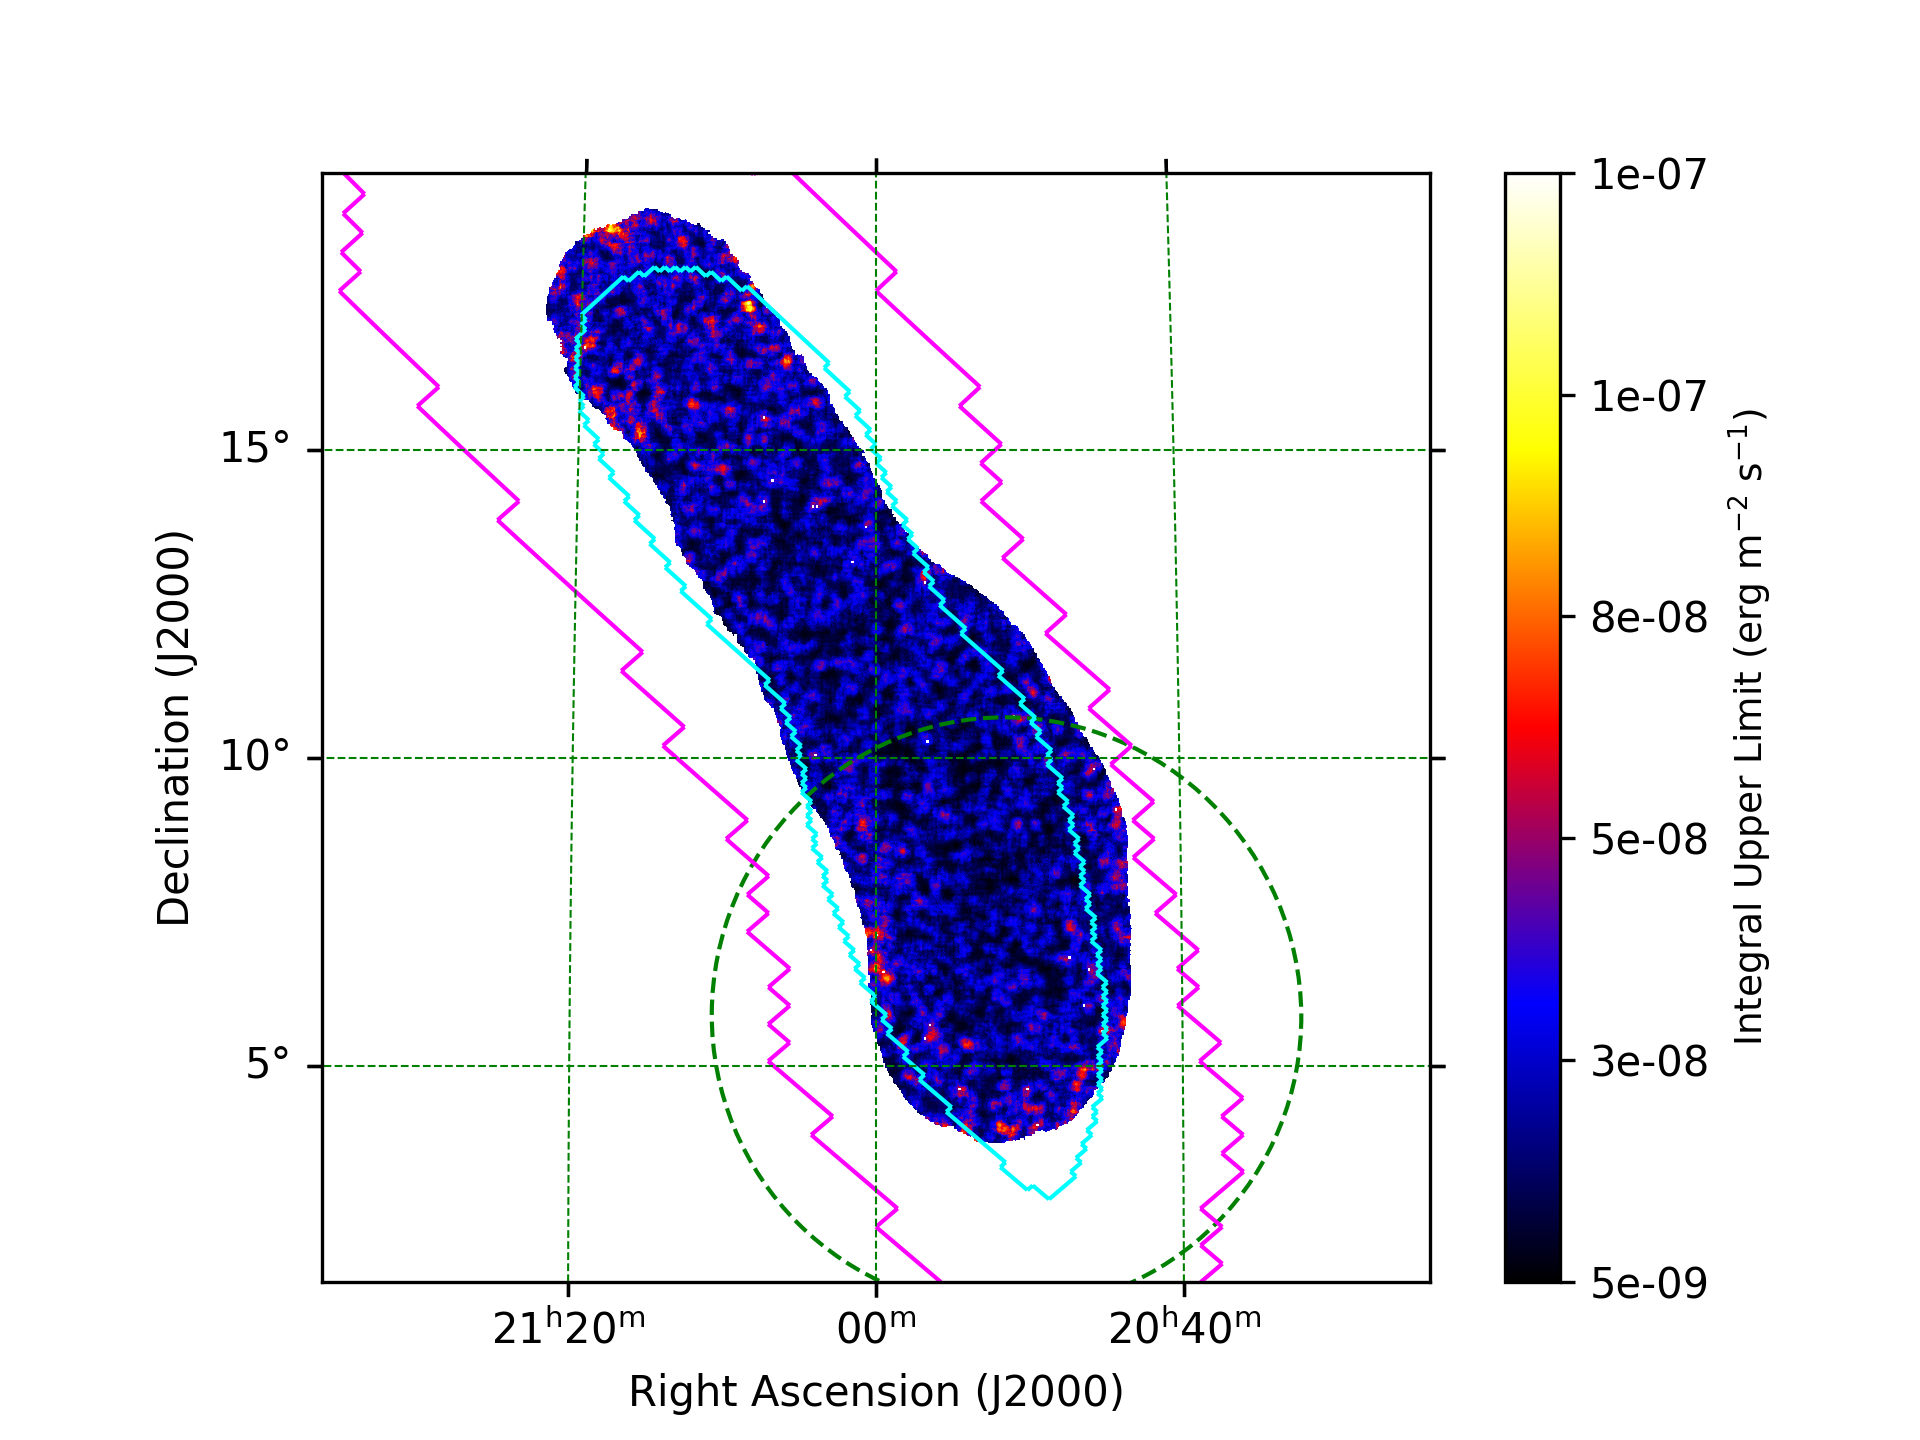
GW170814
| Content | GW170814 |
|---|---|
| Integral upper limits assuming an E^-2 spectrum
1TeV < E < 10TeV Fig. 2 and Fig.6 |
 |
| Integral energy flux limits assuming an E^-2 spectrum
1TeV < E < 10TeV |
 |
| Luminosity limits
1/(1+z)TeV < E < 10/(1+z)TeV Fig. 3 and Fig.8 |
 |
| Integral upper limits assuming an E^-2 spectrum and EBL absorption
individual energy ranges (cf. Tab. 2) Fig. 7 |
 |
| Integral energy flux limits assuming an E^-2 spectrum and EBL absorption
individual energy ranges (cf. Tab. 2) |
 |
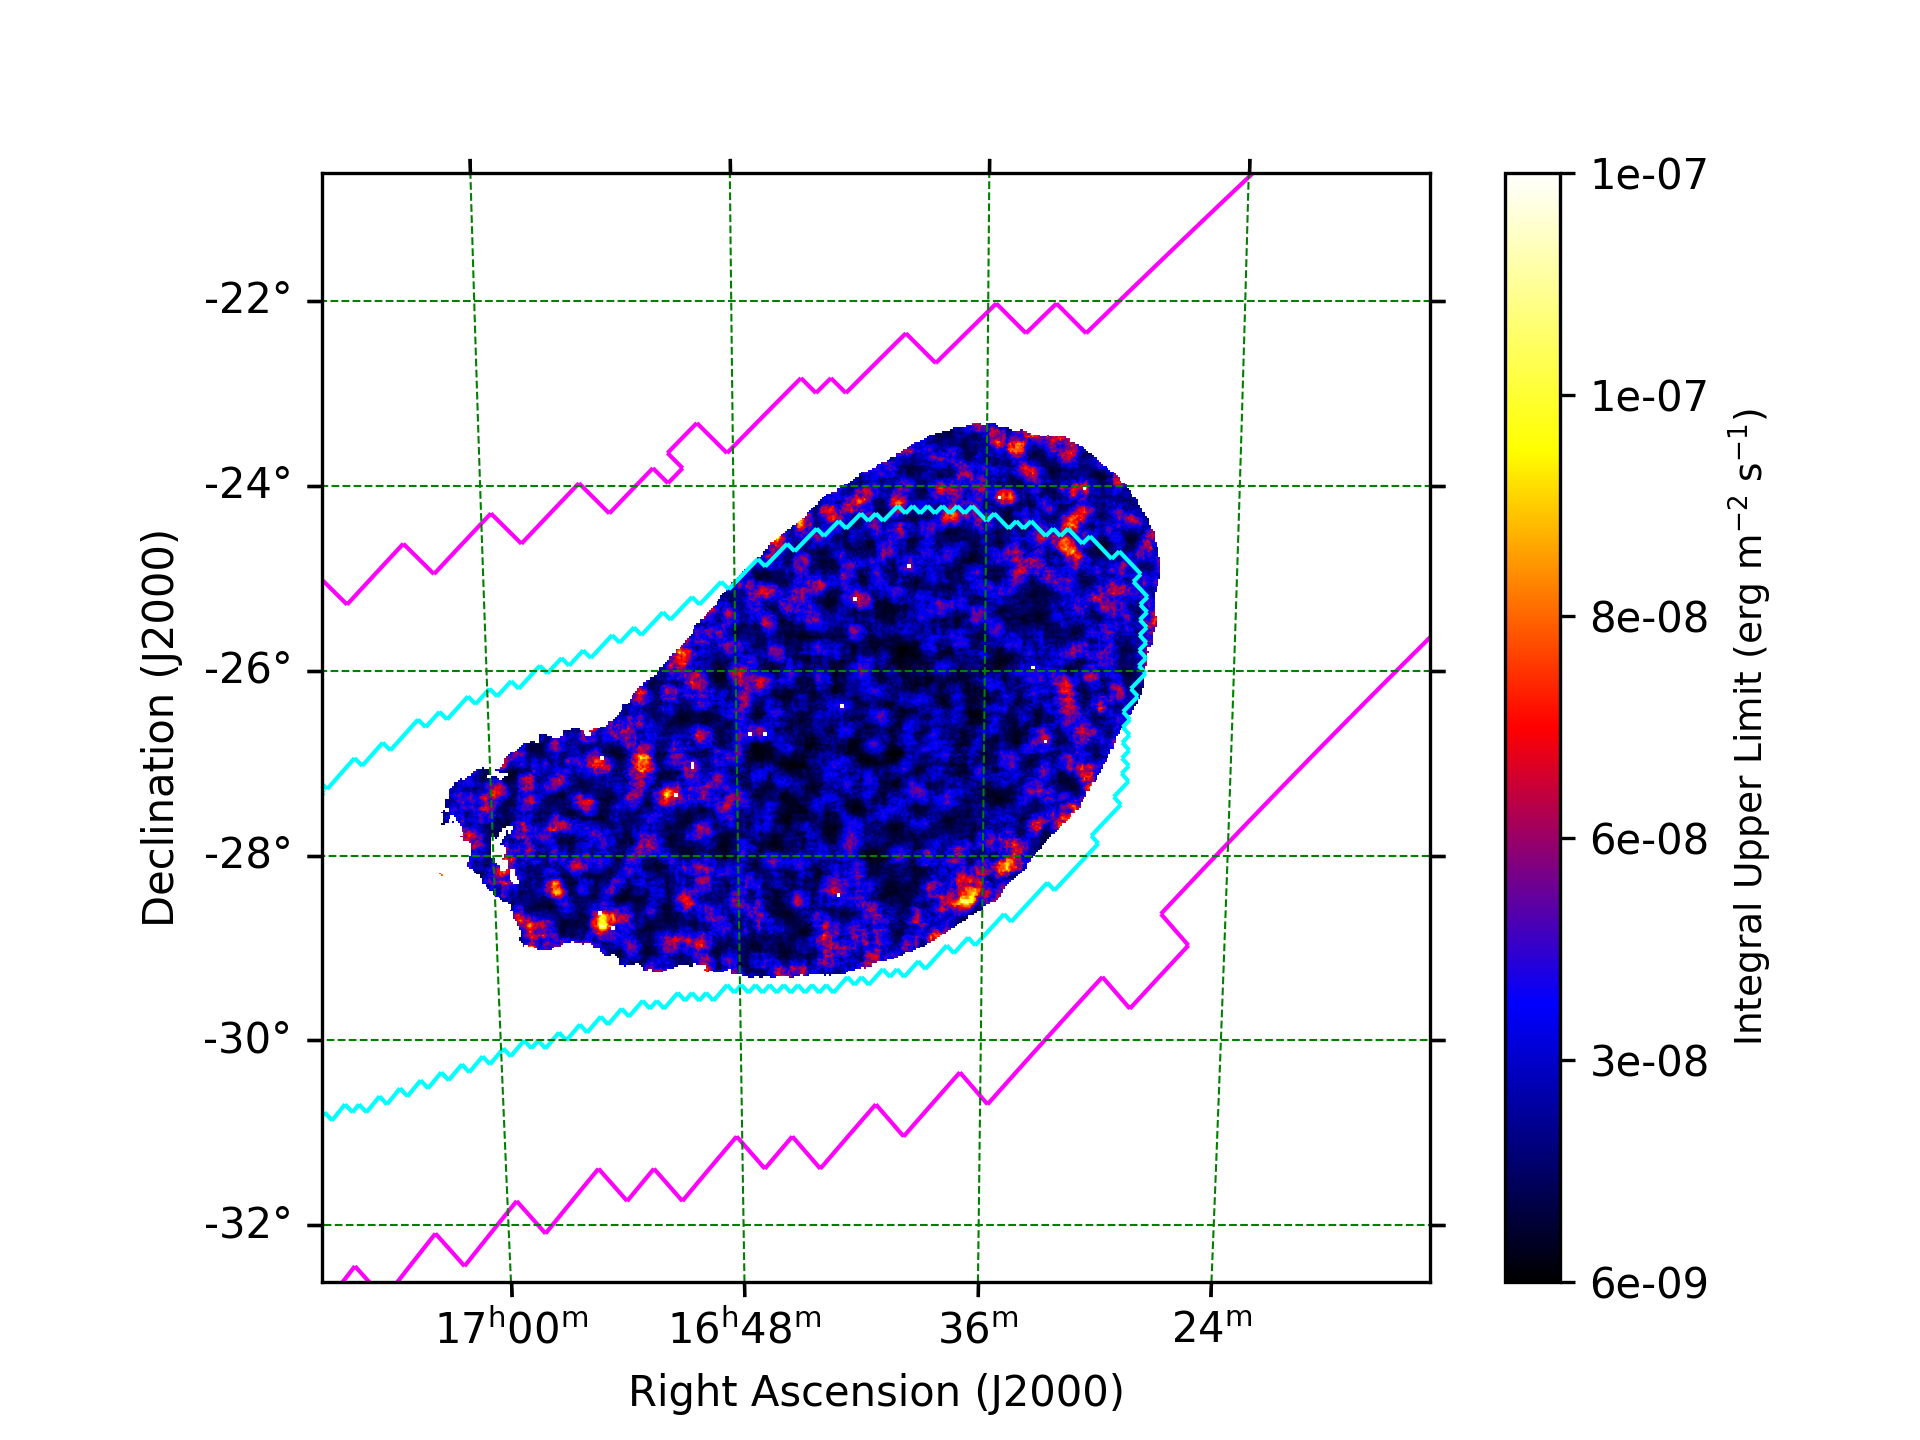
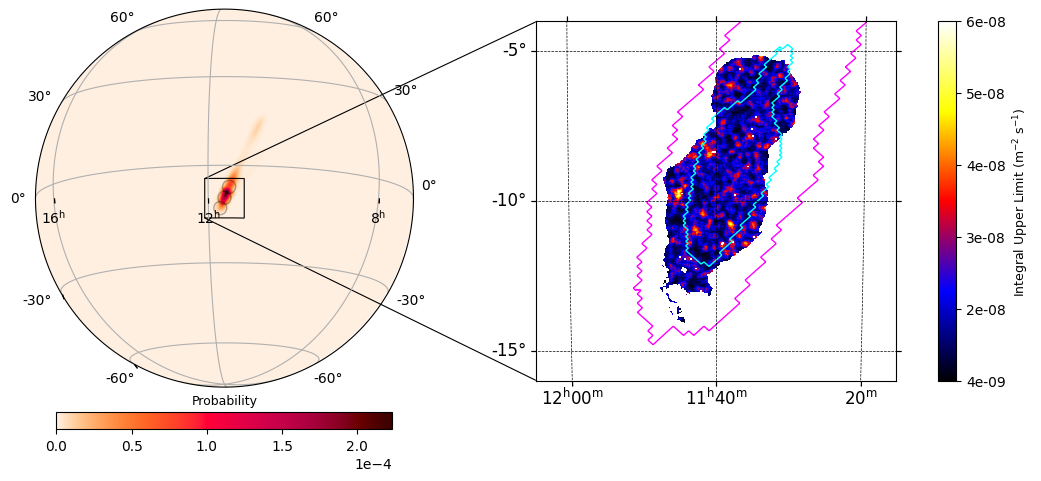
GW190512_180714
| Content | GW190512_180714 |
|---|---|
| Integral upper limits assuming an E^-2 spectrum
1TeV < E < 10TeV Fig. 2 and Fig.6 |
 |
| Integral energy flux limits assuming an E^-2 spectrum
1TeV < E < 10TeV |
 |
| Luminosity limits
1/(1+z)TeV < E < 10/(1+z)TeV Fig. 3 and Fig.8 |
 |
| Integral upper limits assuming an E^-2 spectrum and EBL absorption
individual energy ranges (cf. Tab. 2) Fig. 7 |
 |
| Integral energy flux limits assuming an E^-2 spectrum and EBL absorption
individual energy ranges (cf. Tab. 2) |
 |
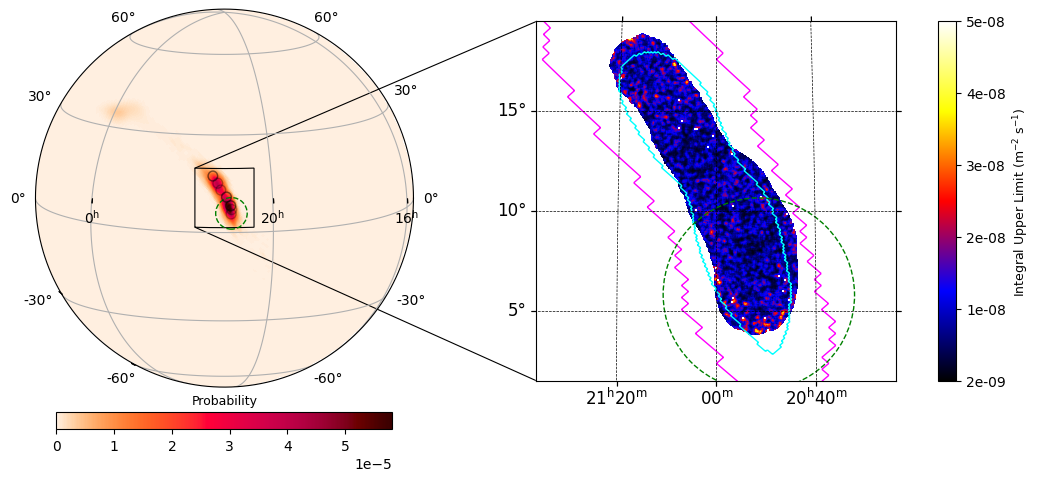
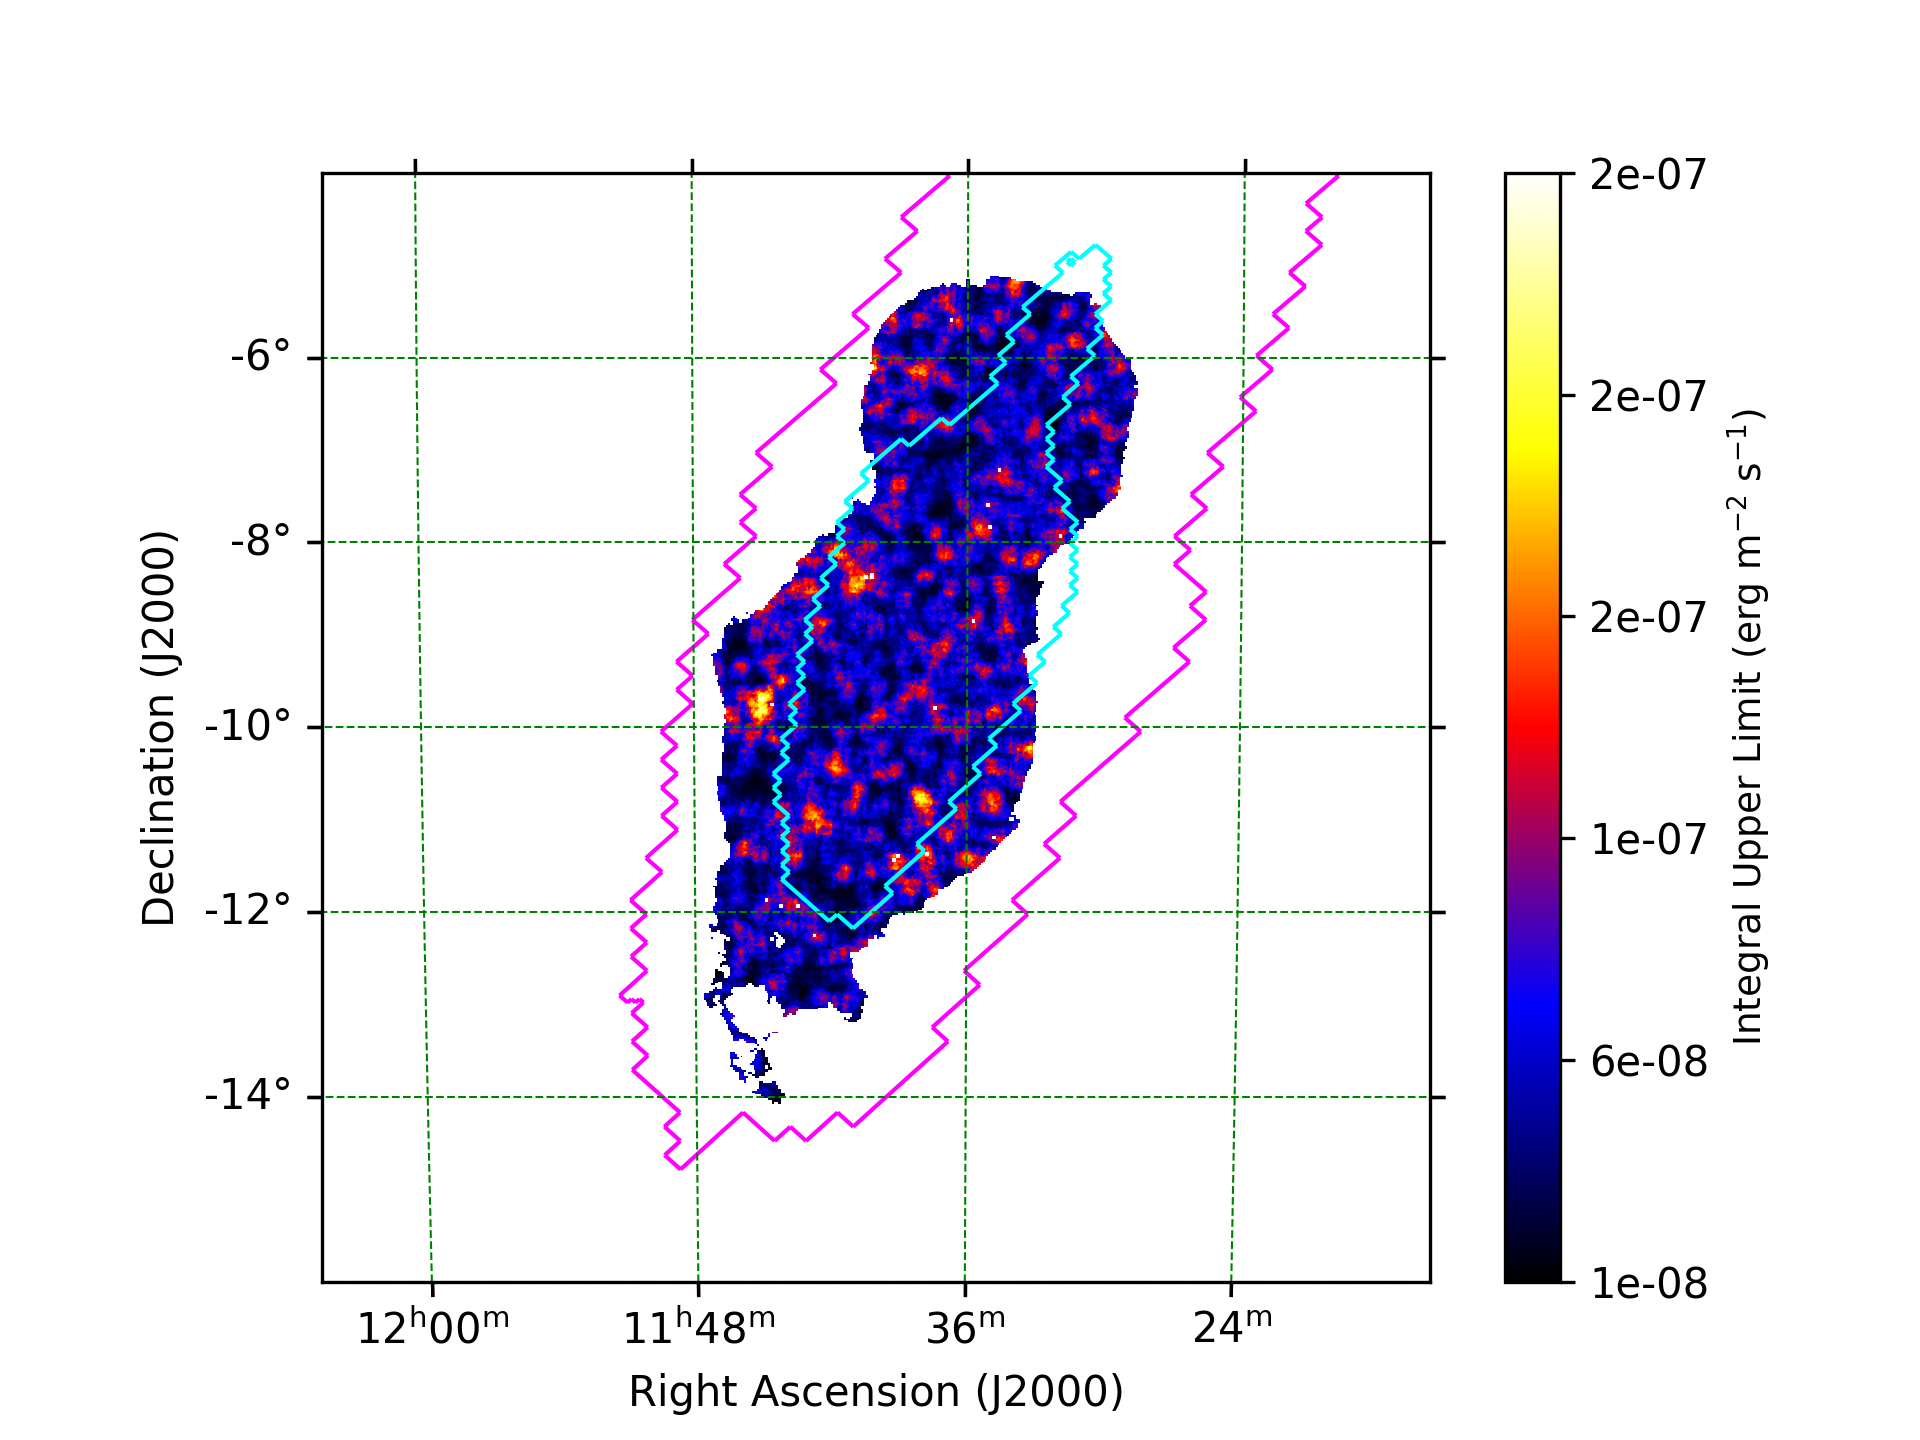
GW190728_064510
| Content | GW190728_064510 |
|---|---|
| Integral upper limits assuming an E^-2 spectrum
1TeV < E < 10TeV Fig. 2 and Fig.6 |
 |
| Integral energy flux limits assuming an E^-2 spectrum
1TeV < E < 10TeV |
 |
| Luminosity limits
1/(1+z)TeV < E < 10/(1+z)TeV Fig. 3 and Fig.8 |
 |
| Integral upper limits assuming an E^-2 spectrum and EBL absorption
individual energy ranges (cf. Tab. 2) Fig. 7 |
 |
| Integral energy flux limits assuming an E^-2 spectrum and EBL absorption
individual energy ranges (cf. Tab. 2) |
 |
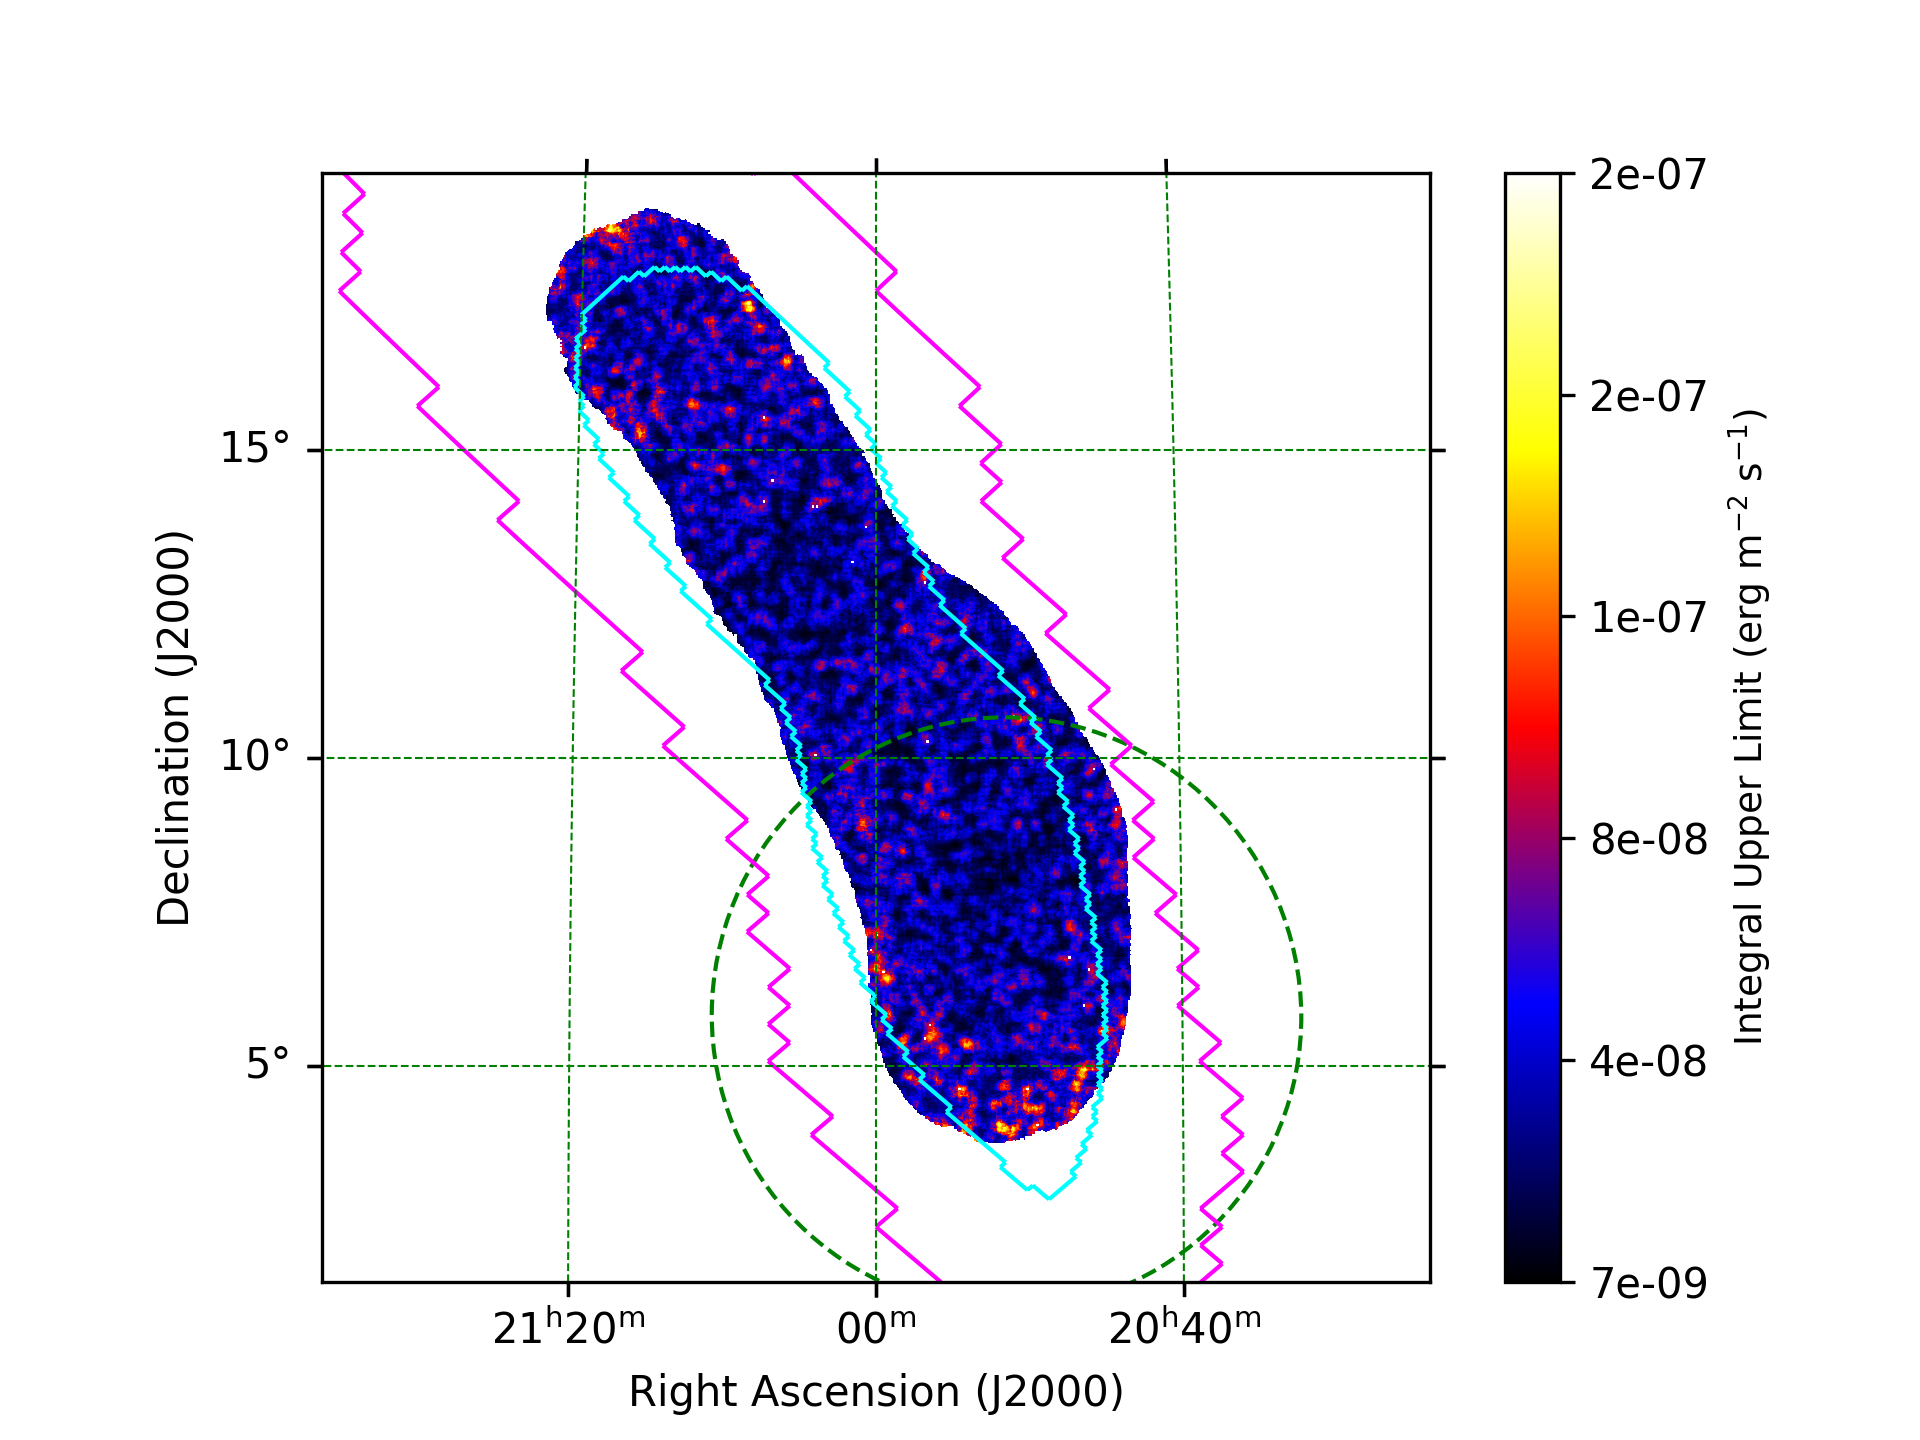
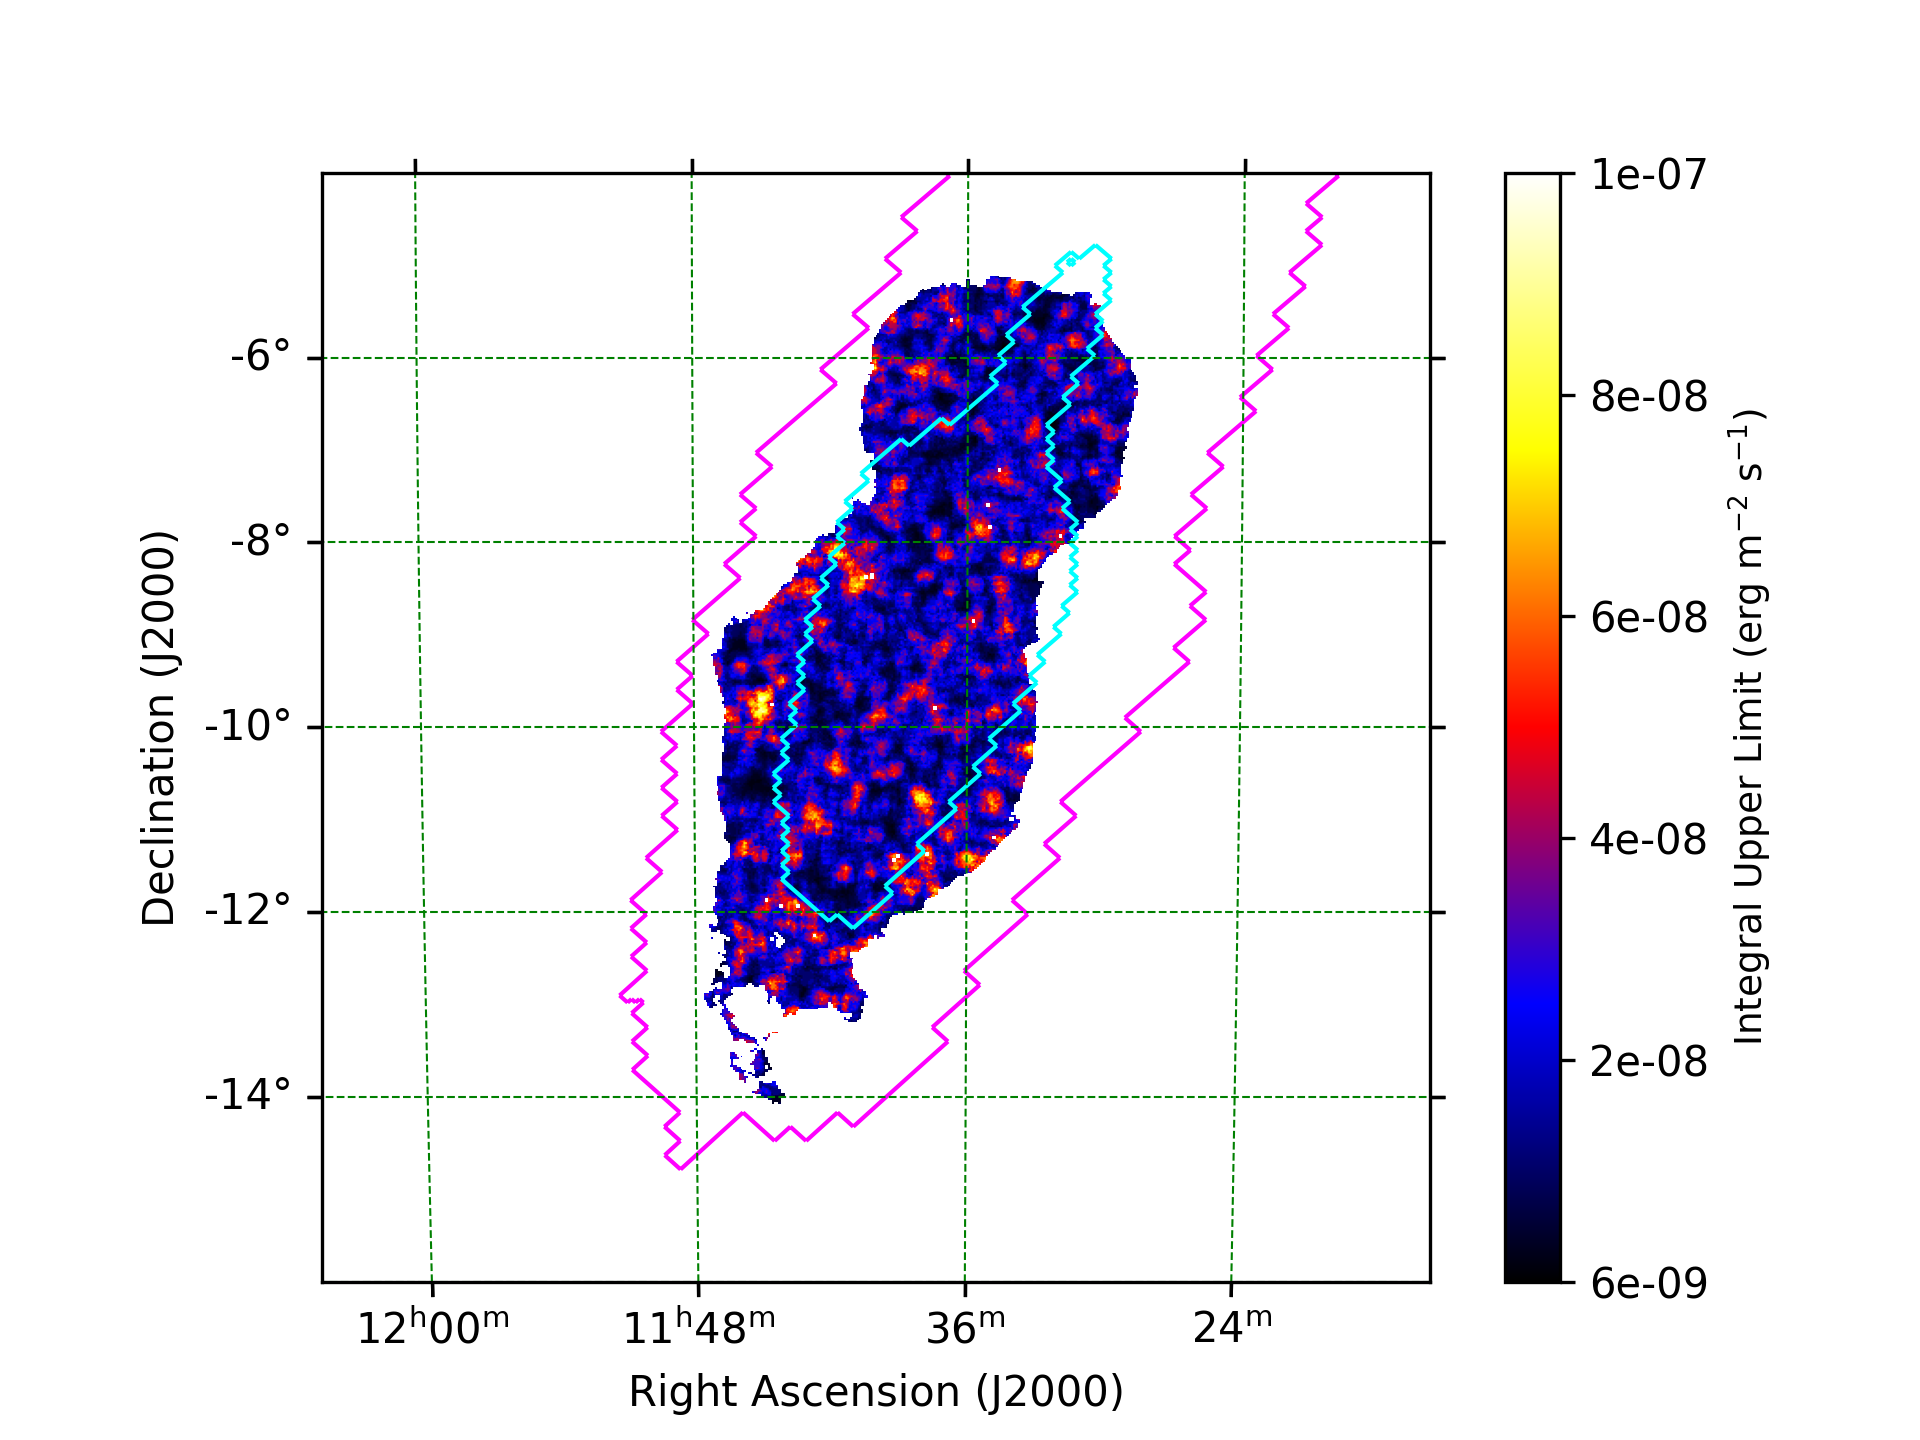
S200224ca
| Content | S200224ca |
|---|---|
| Integral upper limits assuming an E^-2 spectrum
1TeV < E < 10TeV Fig. 2 and Fig.6 |
 |
| Integral energy flux limits assuming an E^-2 spectrum
1TeV < E < 10TeV |
 |
| Luminosity limits
1/(1+z)TeV < E < 10/(1+z)TeV Fig. 3 and Fig.8 |
 |
| Integral upper limits assuming an E^-2 spectrum and EBL absorption
individual energy ranges (cf. Tab. 2) Fig. 7 |
 |
| Integral energy flux limits assuming an E^-2 spectrum and EBL absorption
individual energy ranges (cf. Tab. 2) |
 |
Collaboration Acknowledgement
The support of the Namibian authorities and of the University of Namibia in facilitating the construction and operation of H.E.S.S. is gratefully acknowledged, as is the support by the German Ministry for Education and Research (BMBF), the Max Planck Society, the German Research Foundation (DFG), the Helmholtz Association, the Alexander von Humboldt Foundation, the French Ministry of Higher Education, Research and Innovation, the Centre National de la Recherche Scientifique (CNRS/IN2P3 and CNRS/INSU), the Commissariat à l’Énergie atomique et aux Énergies alternatives (CEA), the U.K. Science and Technology Facilities Council (STFC), the Knut and Alice Wallenberg Foundation, the National Science Centre, Poland grant no. 2016/22/M/ST9/00382, the South African Department of Science and Technology and National Research Foundation, the University of Namibia, the National Commission on Research, Science & Technology of Namibia (NCRST), the Austrian Federal Ministry of Education, Science and Research and the Austrian Science Fund (FWF), the Australian Research Council (ARC), the Japan Society for the Promotion of Science and by the University of Amsterdam. We appreciate the excellent work of the technical support staff in Berlin, Zeuthen, Heidelberg, Palaiseau, Paris, Saclay, Tübingen and in Namibia in the construction and operation of the equipment. This work benefited from services provided by the H.E.S.S. Virtual Organisation, supported by the national resource providers of the EGI Federation.
